Project Index
Crypto Evaluation & Readiness for Infrastructure Adaptation (Post-Quantum)
Overview
Post-Quantum Cryptography Scanner implementing Malaysia's NCII SCAD Framework.Quick Links
- Quick Start - Get started in 5 minutes
- User Manual - Complete feature documentation
- API Reference - REST API endpoints
- Deployment Guide - Production deployment
- Admin Guide - Administration tasks
Project Details
- Status: ✅ Deployed and Live
- URL: https://pqcs.dysfunktion.tech
- Platform: cPanel Shared Hosting
- Stack: Python 3.11, FastAPI, SQLite
Key Features
- 7 Cryptographic Collectors (TLS, SSH, VPN, DB, OS, App Config, Cert Store)
- SCAD Risk Scoring Framework (7 criteria)
- HNDL Risk Calculator (Mosca's Inequality)
- Certificate Chain Analysis
- MySEAL Compliance
- Web Dashboard + CLI
Last Updated: 2026-07-10
Getting Started
Crypto Evaluation & Readiness for Infrastructure Adaptation (Post-Quantum)
1. First Time Setup (5 minutes)
# Install dependencies
pip install -e .

# Start the dashboard
ceria --verbose dashboard
# Server starts at http://localhost:8080
Once running, open your browser and go to http://localhost:8080/login:
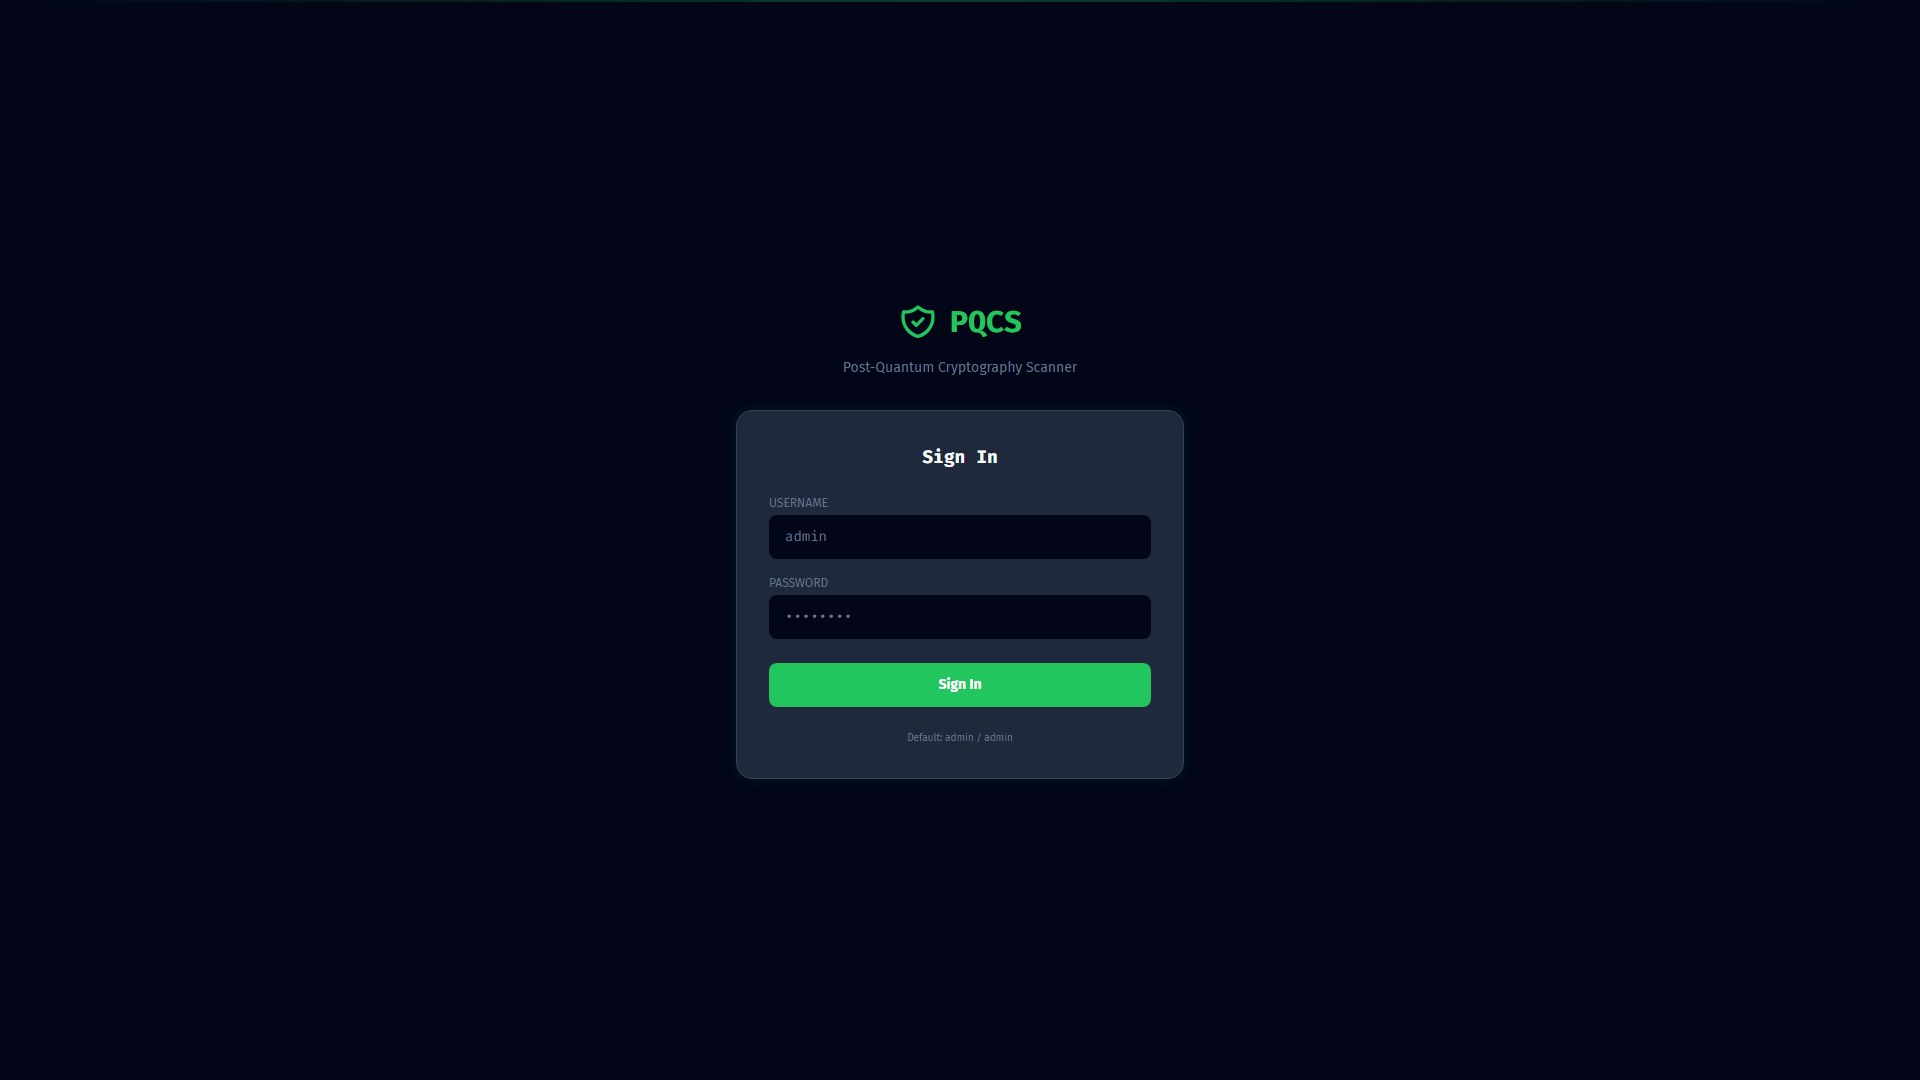 First time login screen - no users exist yet
Click "Register" to create your first admin user, then login:
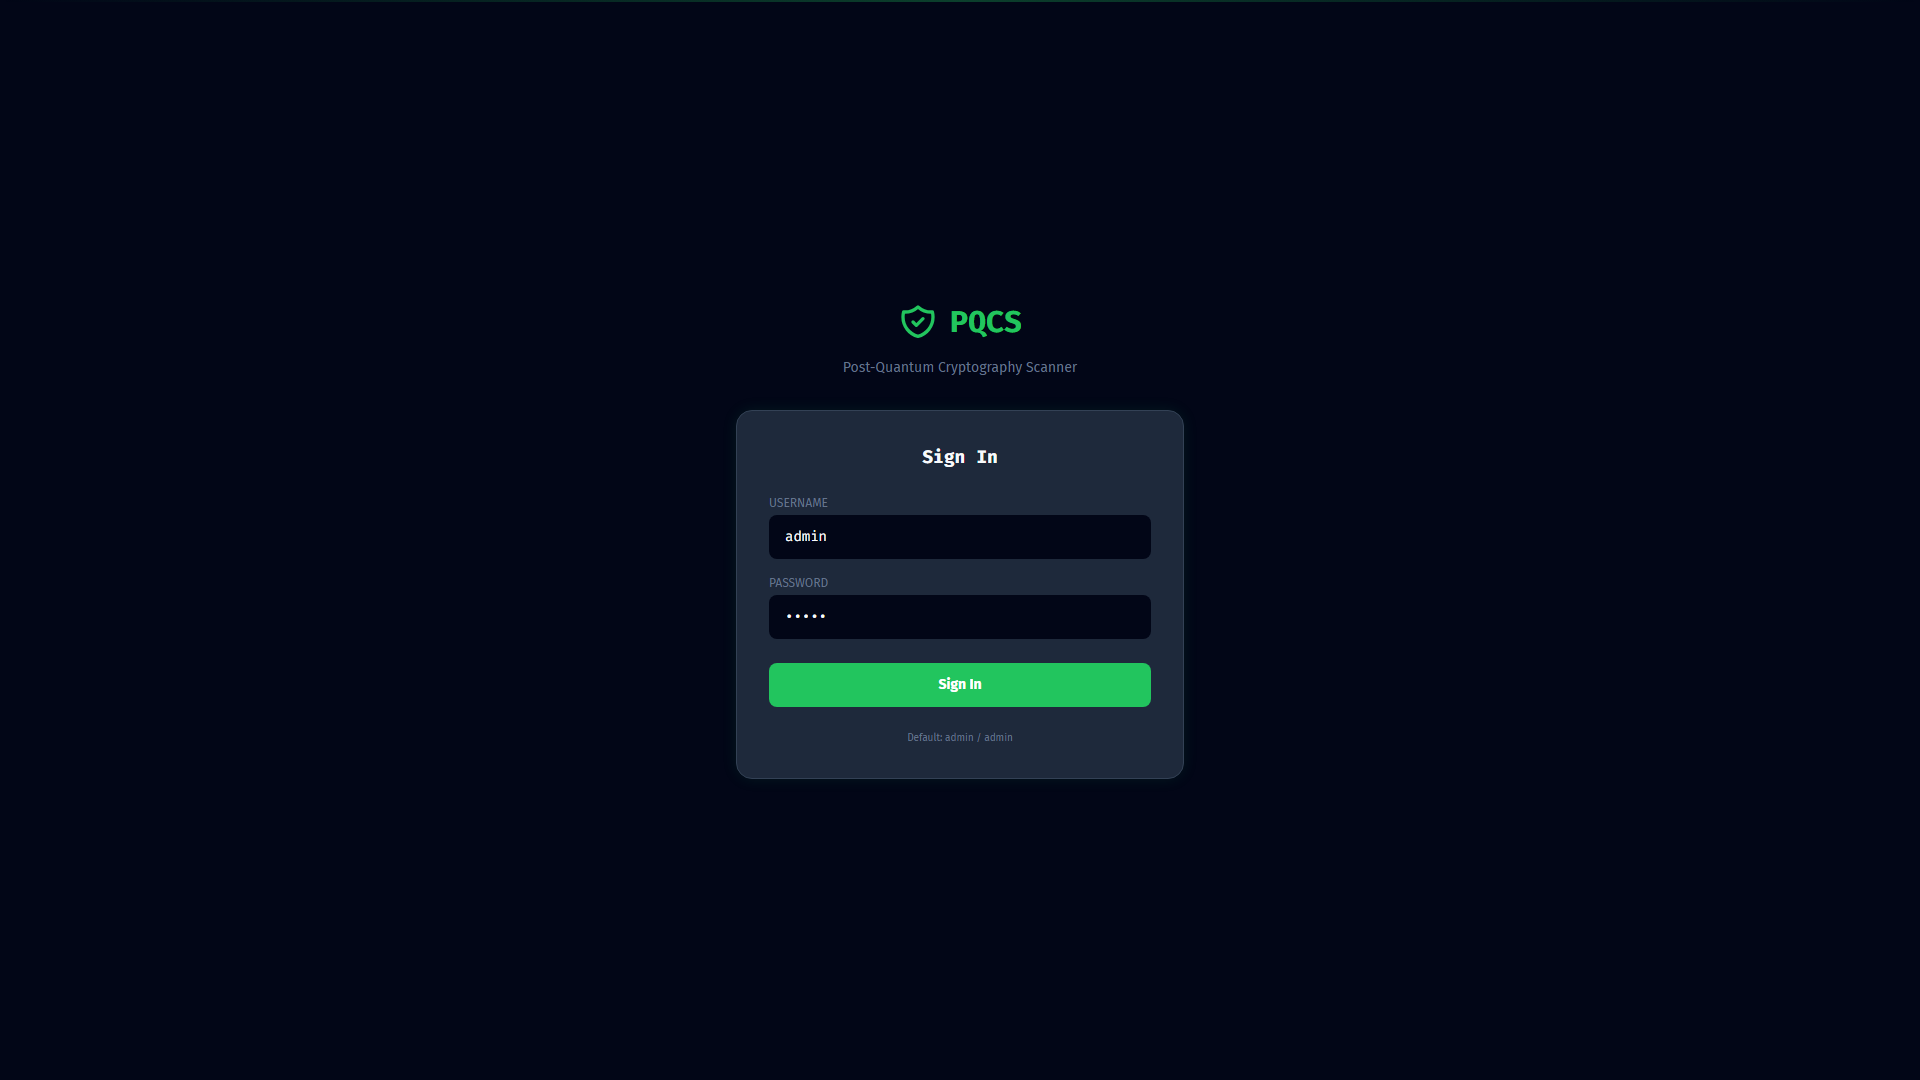 Enter your admin credentials
After login, you'll see the main dashboard:
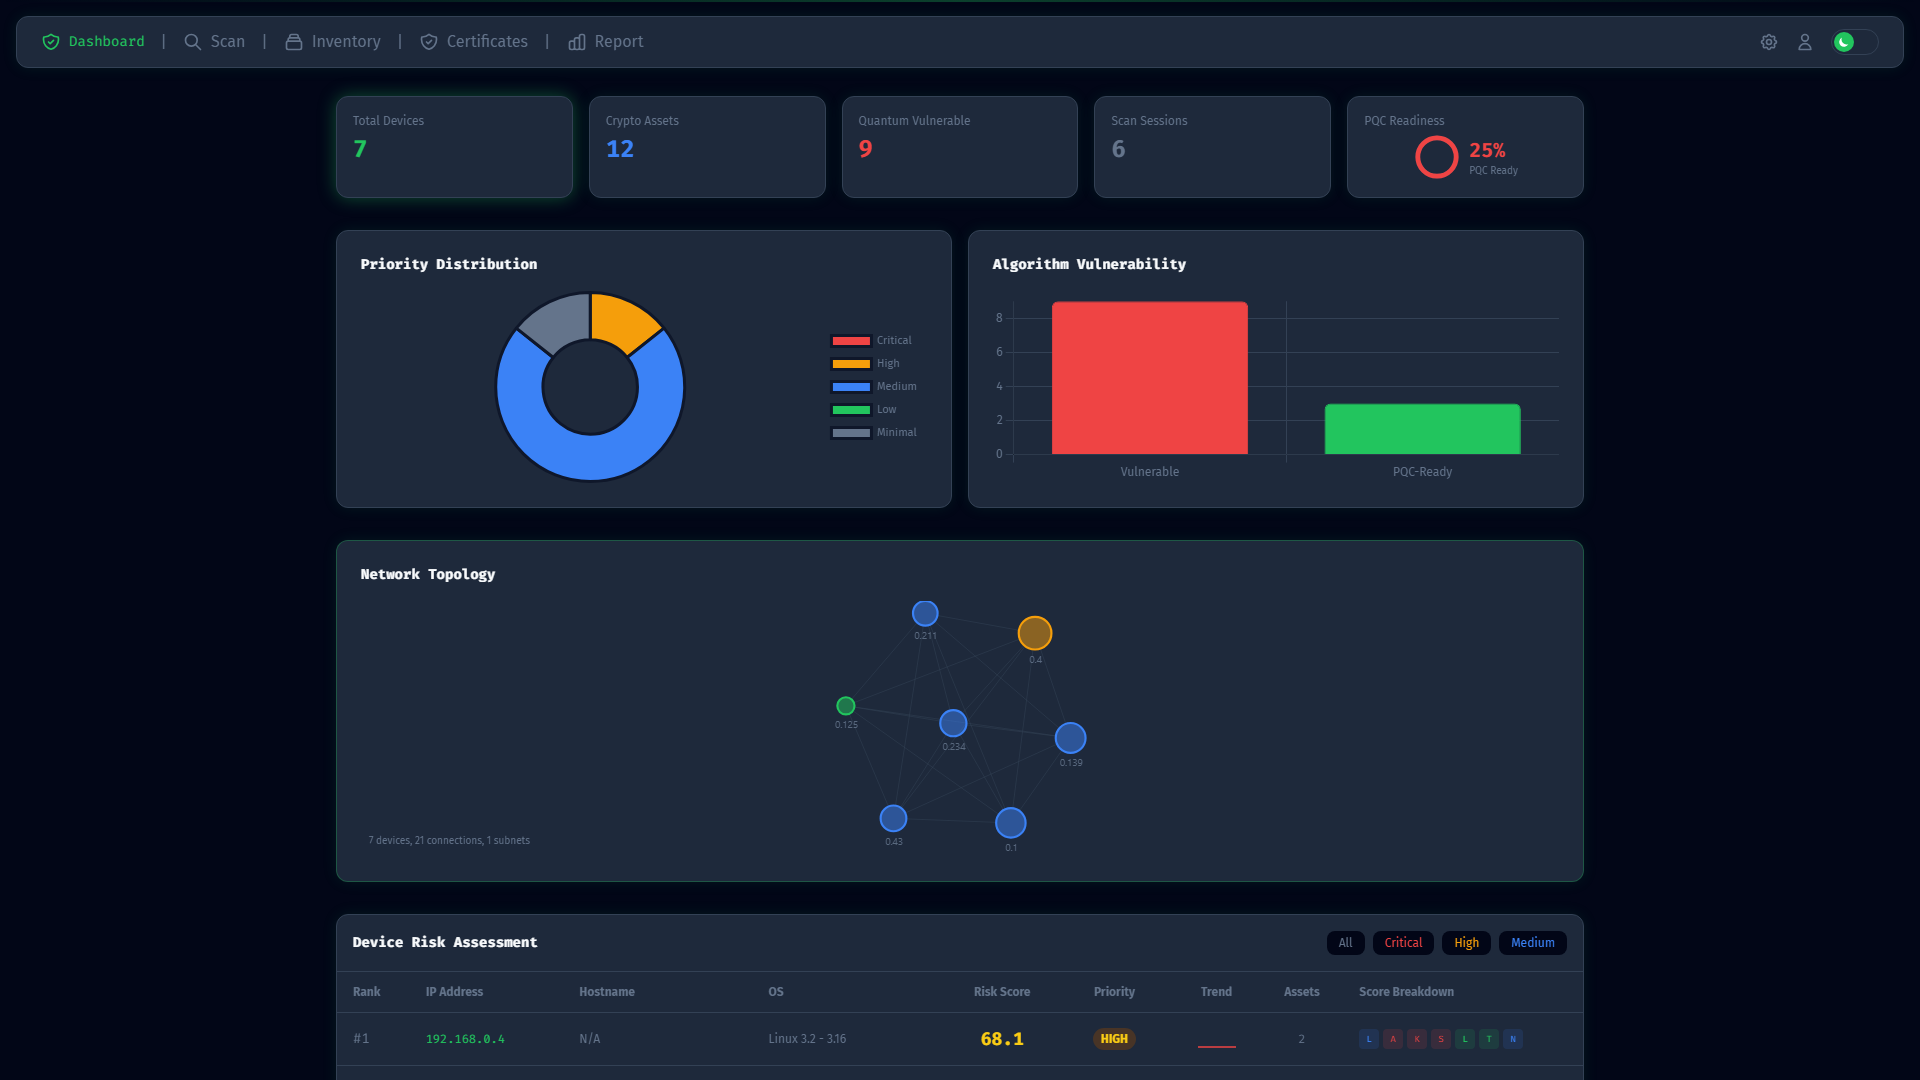 Dashboard ready for your first scan
2. Run Your First Scan (5 minutes)
Option A: CLI
# Scan your local network
ceria scan 192.168.1.0/24 --name "My First Scan"

# Or scan a specific subnet
ceria scan 10.0.0.0/24 --verbose
Option B: Web Dashboard (Recommended for First Time)
- Open http://localhost:8080/scan or click "New Scan" in the sidebar
- You'll see the scan configuration page:
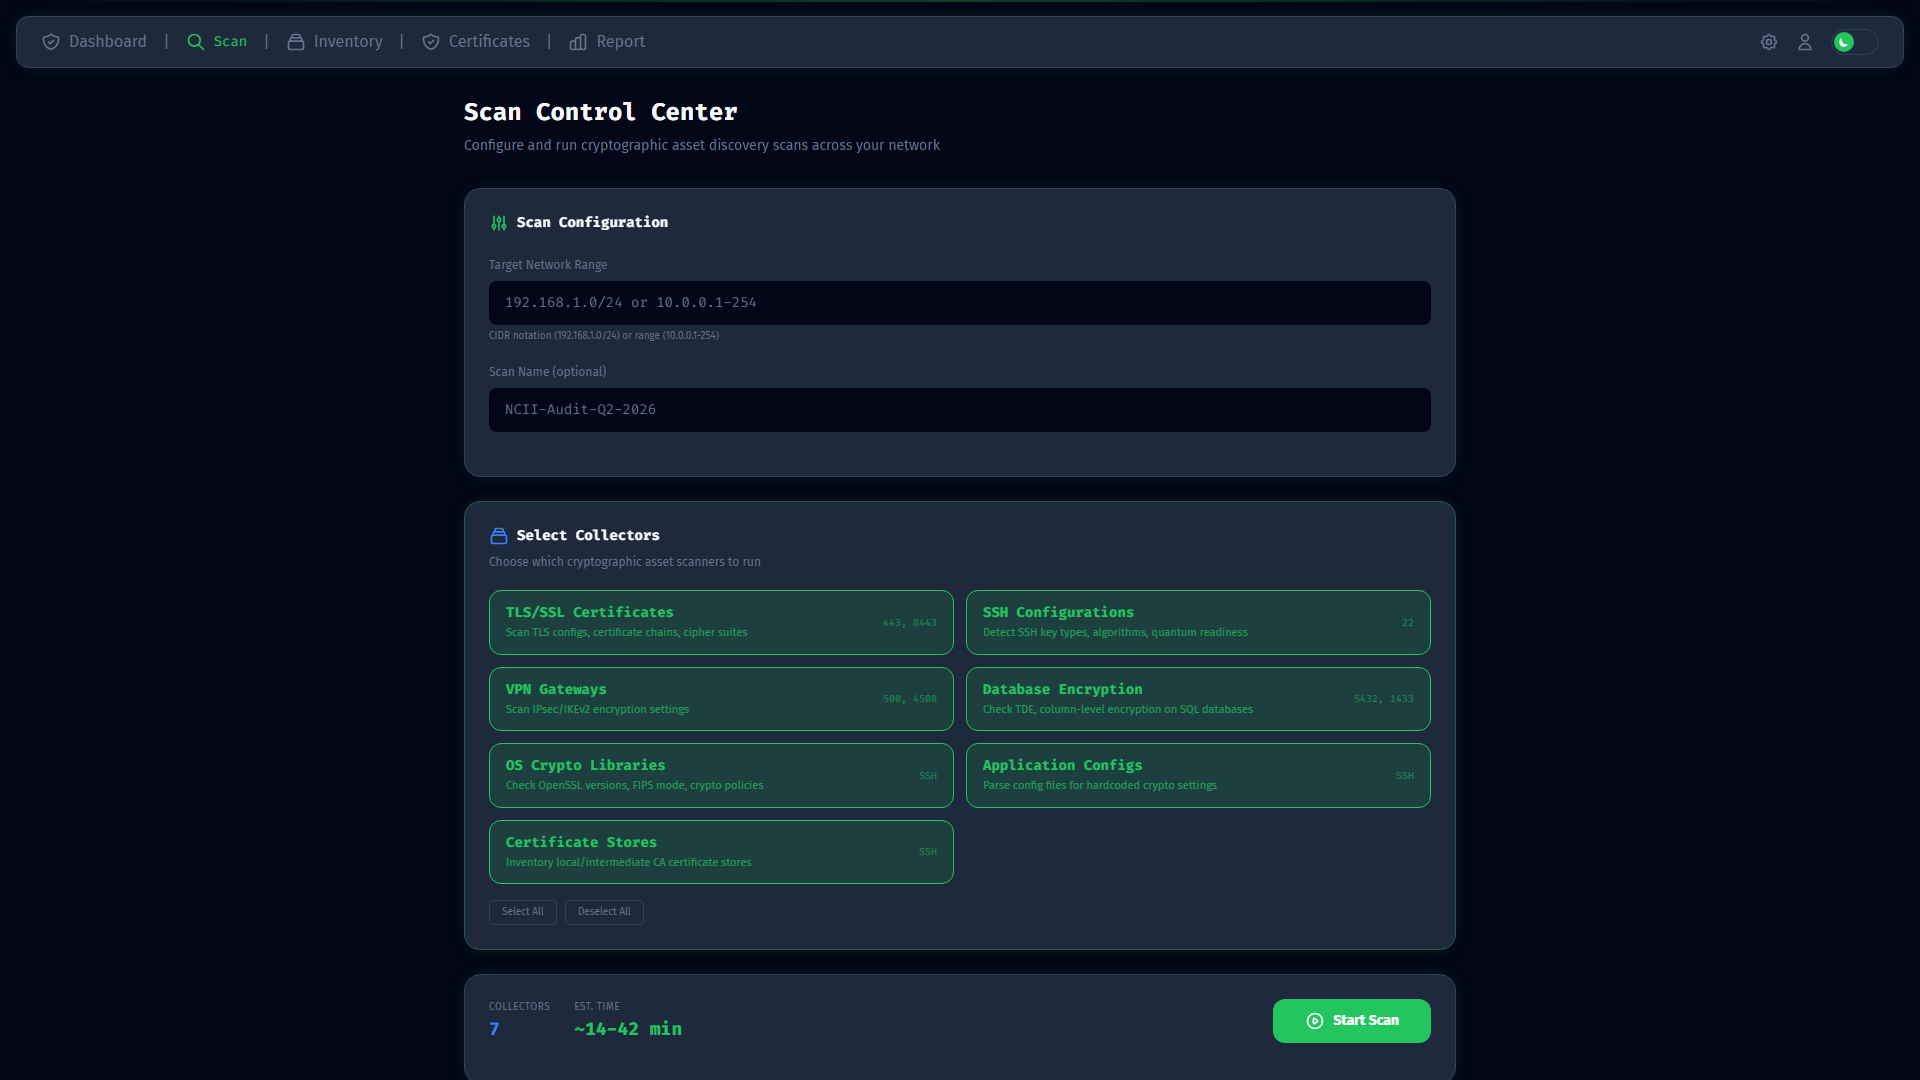 Scan configuration with collectors and target settings
- Enter your target network (e.g.,
192.168.1.0/24) - Enable relevant collectors:
- Port Scan - Always enabled, discovers hosts
- TLS/SSL Scanner - Check HTTPS services
- SSH Scanner - Check SSH keys and algorithms
- Certificate Scanner - Analyze X.509 certificates
- Click "Start Scan"
The scan will run and you'll see progress updates in real-time.
3. View Results (2 minutes)
CLI
# View scan results as table
ceria report --session 1 --format table

# Export to CSV for spreadsheet analysis
ceria report --session 1 --format csv --output scan_results.csv

# Generate PDF report
ceria report --session 1 --format pdf --output scan_report.pdf
Web Dashboard
- Go to Scan Detail page (click on the scan from the dashboard)
- Expand devices to see findings:
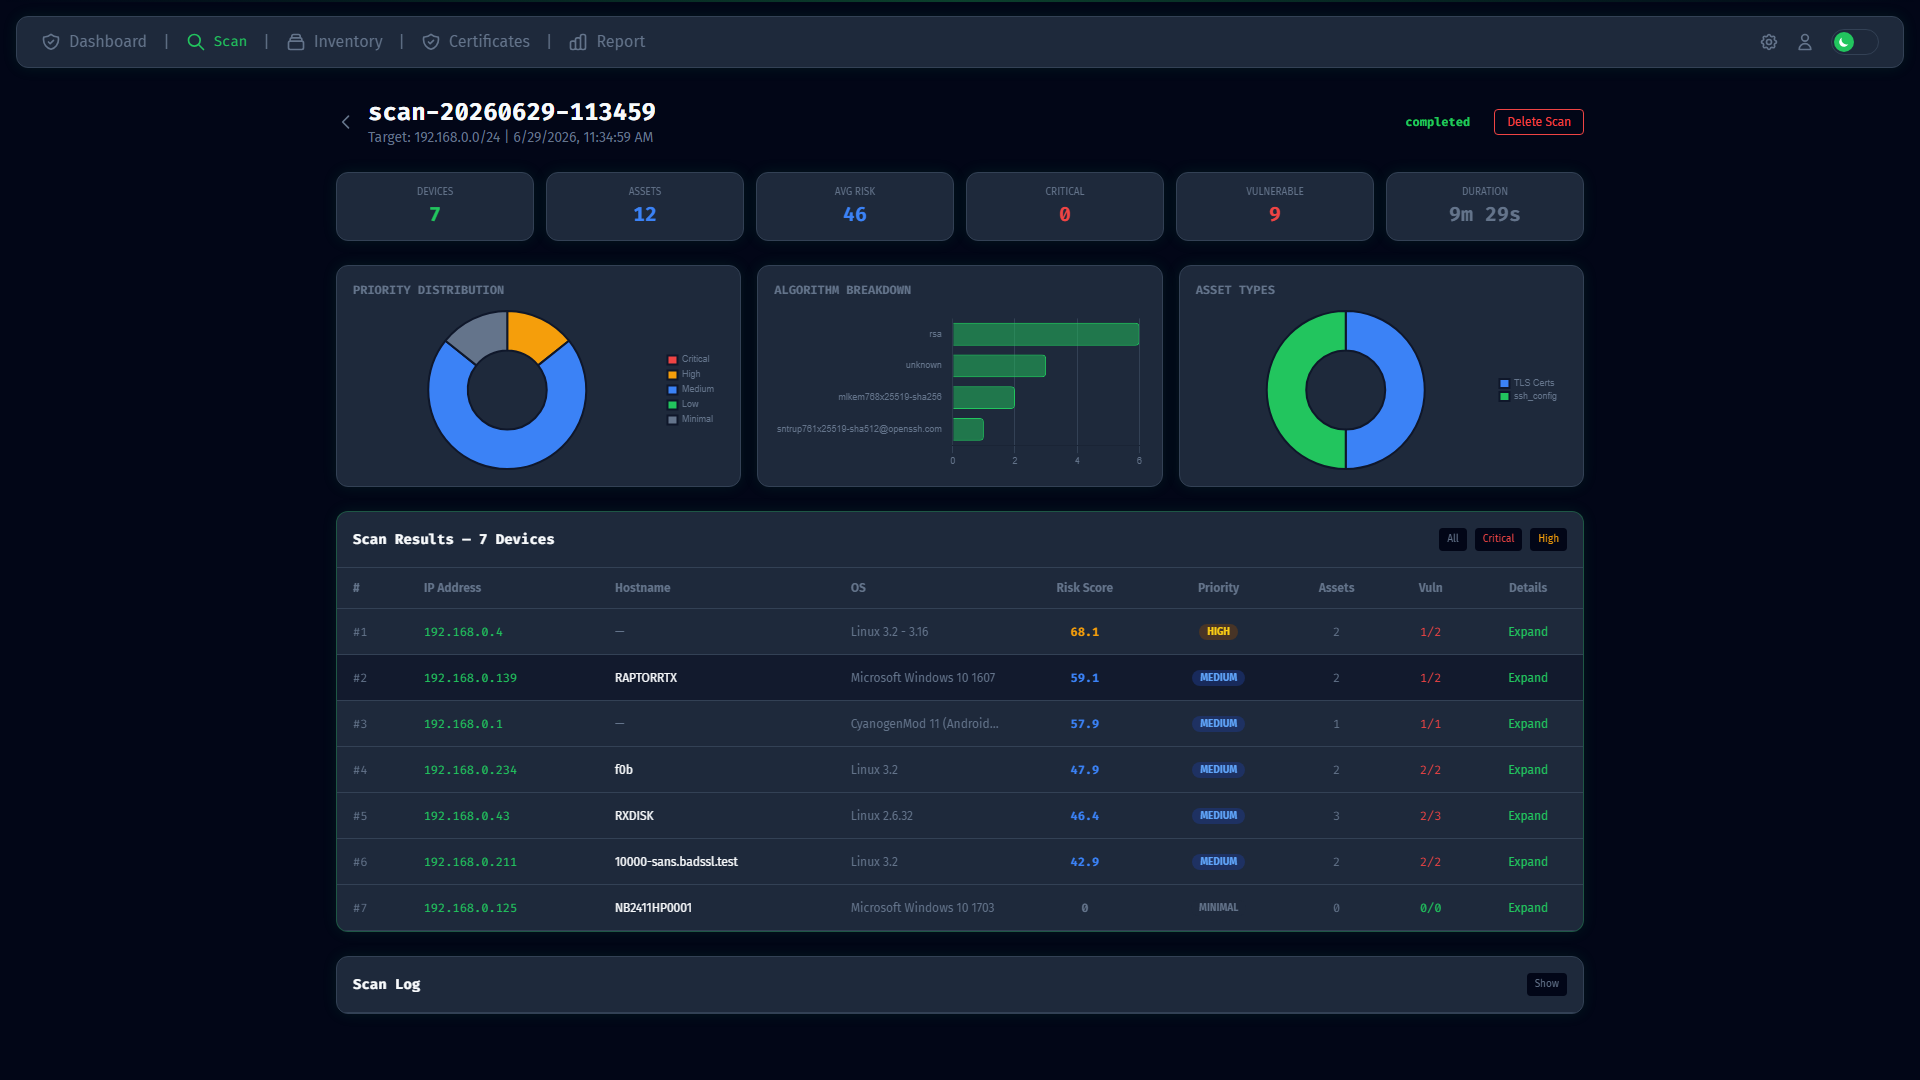 Scan results showing discovered devices and their crypto assets
- Click on any device to see detailed analysis:
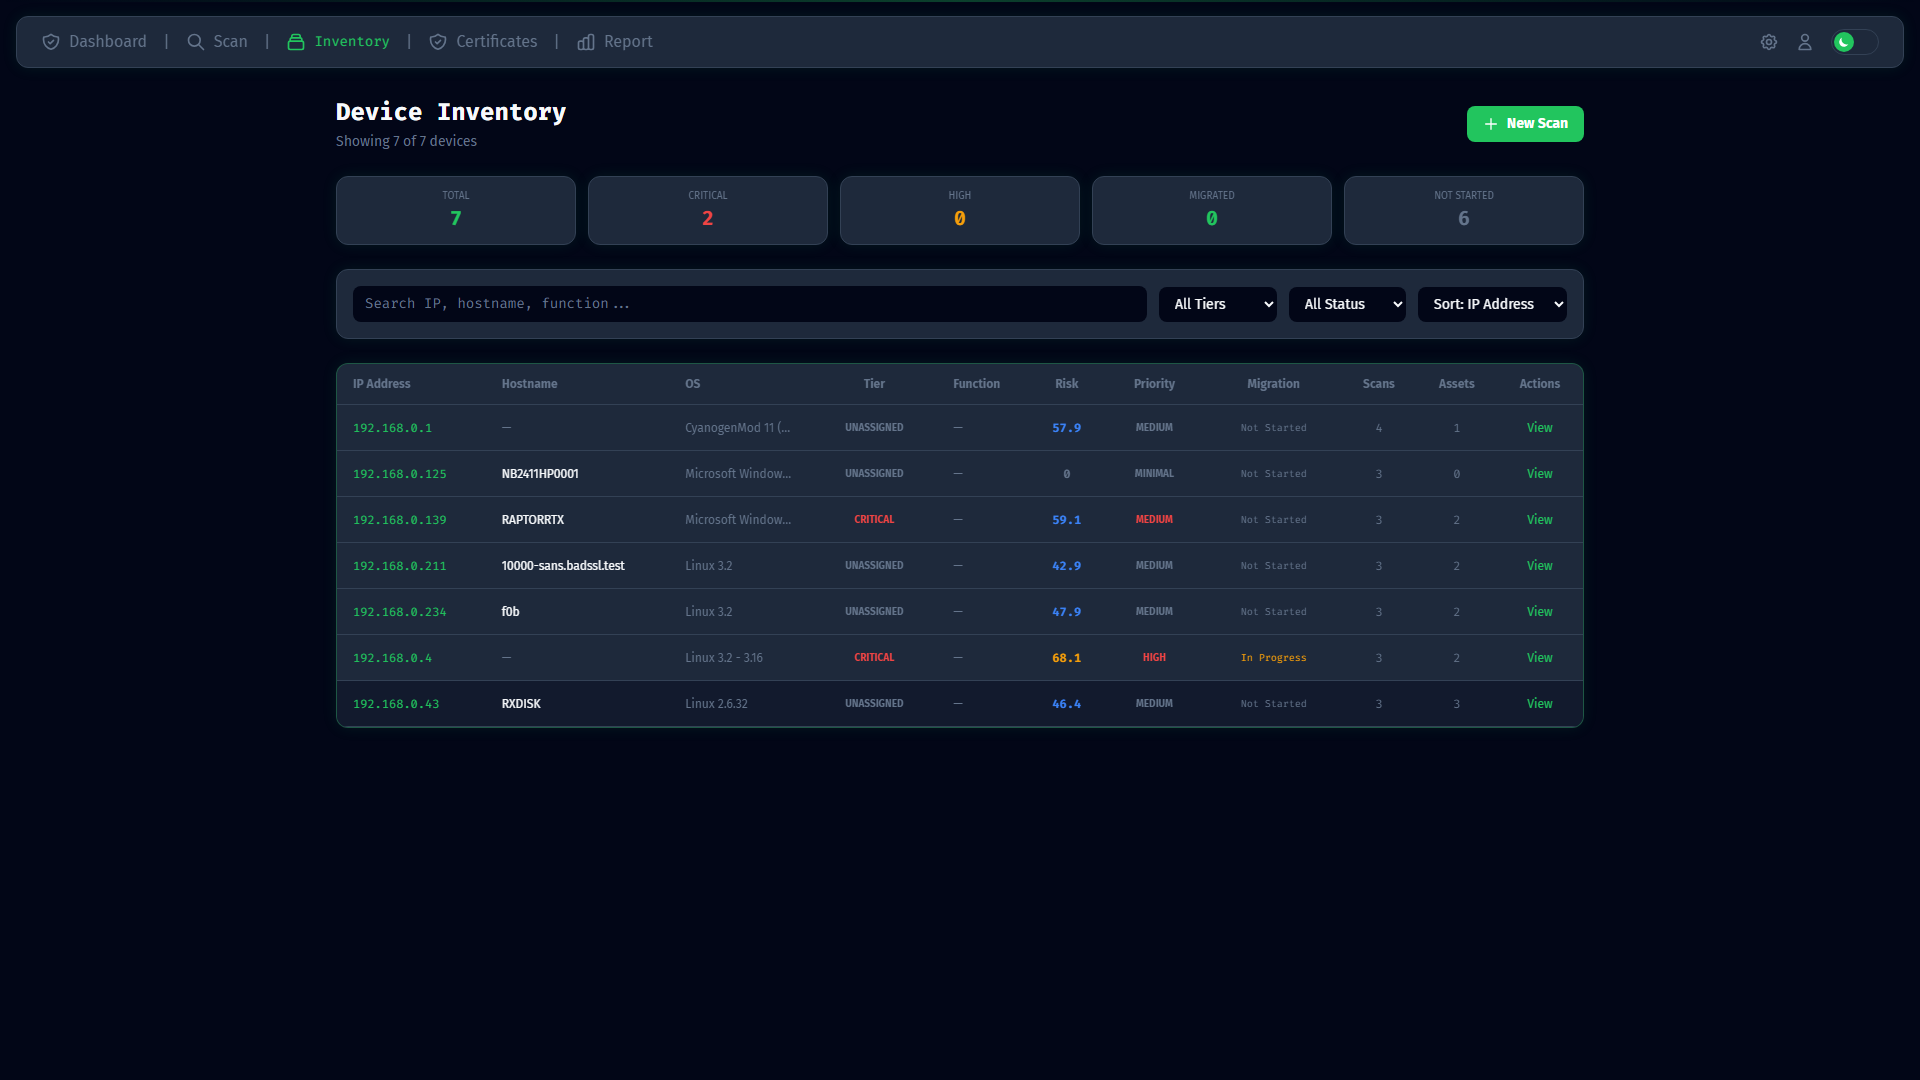 Device inventory with risk scores and PQC status
- View Reports for visual analytics:
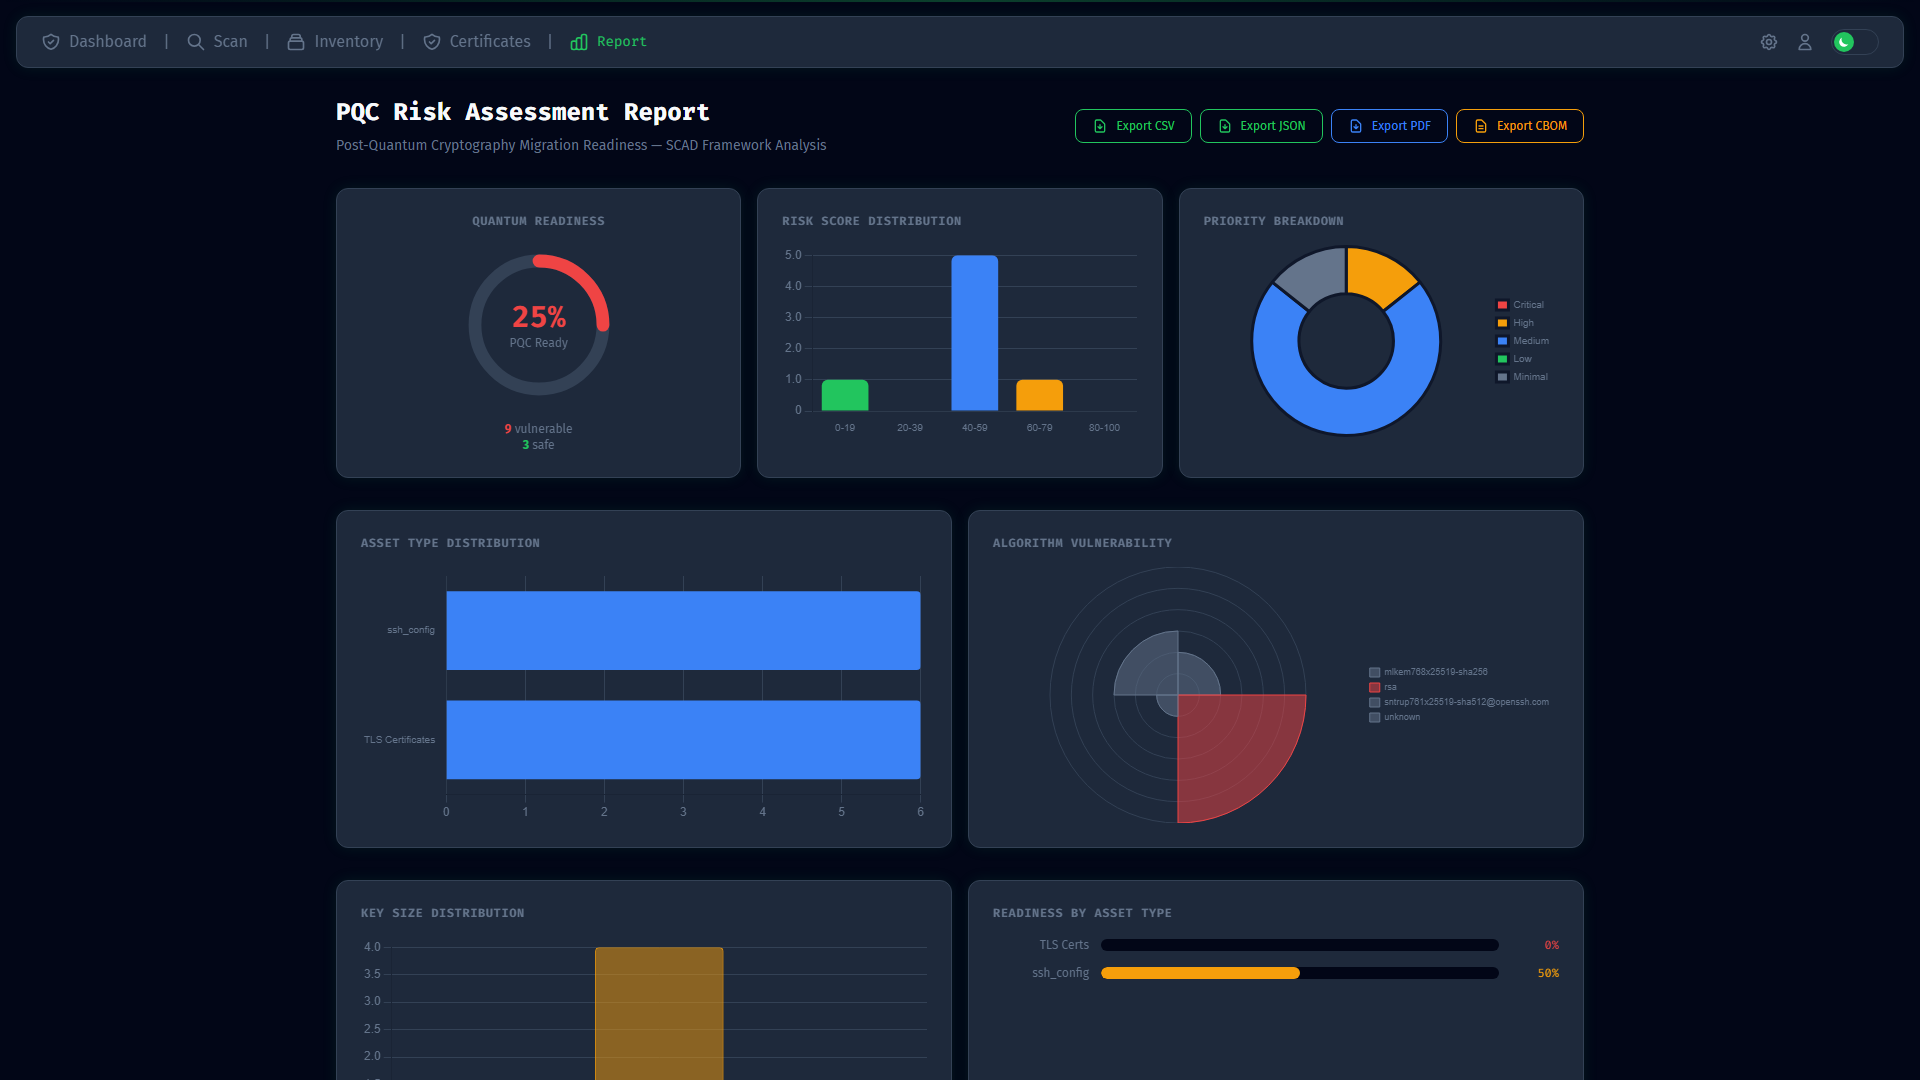 Risk heatmap and PQC readiness visualization
Congratulations! You've completed your first PQC scan. Continue to the User Manual for detailed feature documentation.
Risk heatmap and PQC readiness visualization
Congratulations! You've completed your first PQC scan. Continue to the User Manual for detailed feature documentation.
Common Commands Cheat Sheet
| Task | Command |
| Start dashboard | ceria dashboard |
| Scan network | ceria scan 192.168.1.0/24 |
| View sessions | pqcs sessions |
| Export CSV | ceria report --session 1 --format csv --output out.csv |
| Export PDF | ceria report --session 1 --format pdf --output out.pdf |
Web Dashboard URLs
| Page | URL |
| Dashboard | / |
| Start Scan | /scan |
| Scan Results | /scan/{id} |
| All Devices | /inventory |
| Device Detail | /inventory/{id} |
| Certificates | /certificates |
| Settings | /settings |
→ See User Manual for complete documentation
Visual Overview
See the Screenshots Gallery for visual walkthrough of all pages.
Installation
Requirements
- Python 3.10+
- nmap (system package)
- OpenSSL libraries
Local Installation
# Clone repository
git clone <repo-url>
cd pqc

# Install with pip
pip install -e .

# Or install development dependencies
pip install -e ".[dev]"

# Verify installation
ceria --version
Environment Setup
Create .env file:
# Required
SECRET_KEY=your-secure-secret-key-here
DATABASE_URL=sqlite:///pqcs.db

# Optional
DASHBOARD_HOST=0.0.0.0
DASHBOARD_PORT=8080
NCII_SECTOR=digital

# SSH Credentials (for remote collectors)
SSH_USERNAME=admin
SSH_PASSWORD=your-ssh-password
SSH_KEY_PATH=/path/to/private/key

# Database Scan Credentials
DB_SCAN_USERNAME=db_user
DB_SCAN_PASSWORD=db_password
NCII Sectors
Available sectors: defense, finance, healthcare, telecom, energy, transport, water, waste, gov, broadcast, digital
→ Next: Quick Start
Overview
What is CERIA?
CERIA discovers cryptographic assets across your network infrastructure and prioritizes them for Post-Quantum Cryptography (PQC) migration.
Main dashboard showing network-wide PQC readiness
Why PQC Migration?
Quantum computers will break current cryptographic algorithms:
- RSA (all key sizes)
- ECDSA/ECDH (all curves)
- DSA/DSS
- Diffie-Hellman
The Threat Timeline
| Year | Milestone |
| 2024-2029 | PQC standards finalized (NIST) |
| 2030 | Malaysia NCII: Symmetric crypto migration deadline |
| 2035 | Malaysia NCII: Asymmetric crypto migration deadline |
| 2035+ | Cryptographically relevant quantum computer expected |
Key Features
1. Automated Discovery
Configure network scans with multiple collectors
2. Risk-Based Prioritization
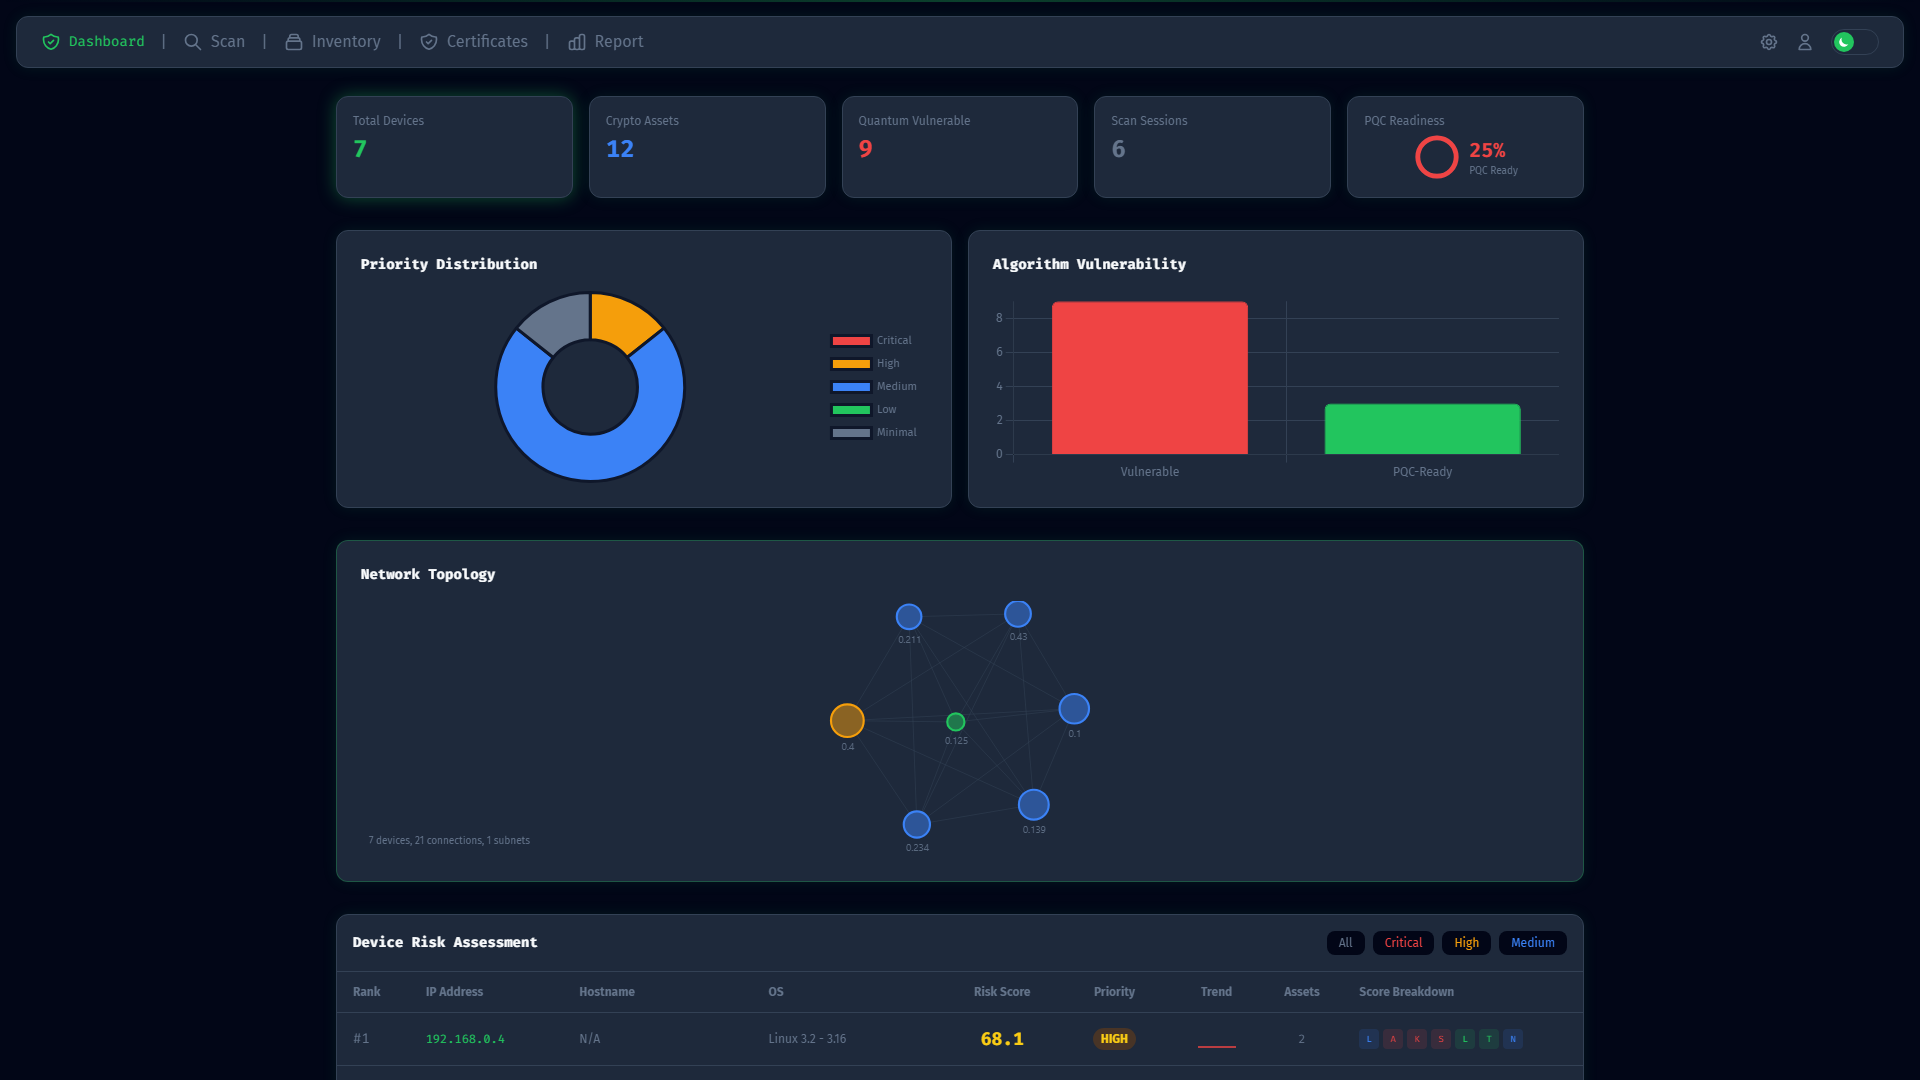 SCAD framework ranks devices by migration urgency
3. Certificate Management
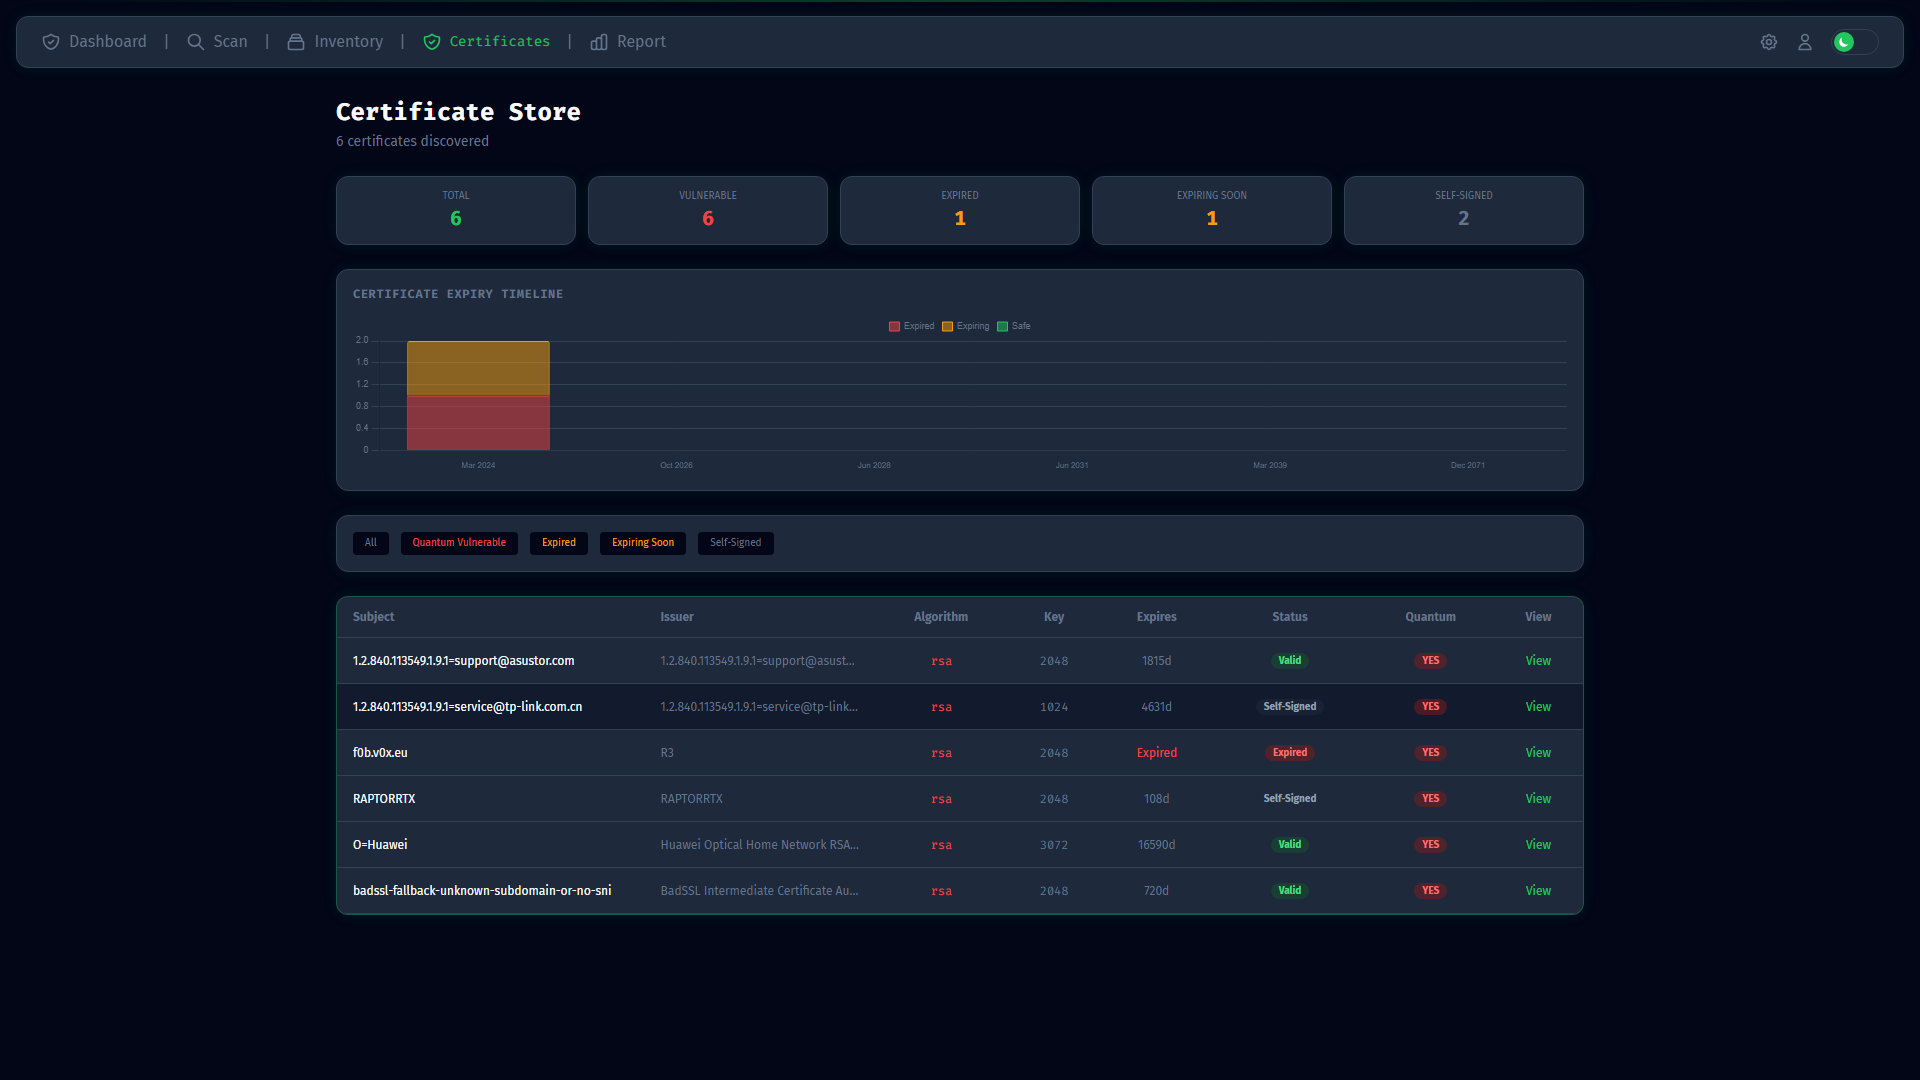 Track all certificates with PQC readiness status
4. Compliance Reporting
Generate reports for:- MySEAL (Malaysia)
- MyKriptografi NCII
- NACSA standards
Who Should Use CERIA?
- CISOs - Strategic PQC migration planning
- Security Engineers - Technical asset discovery
- Compliance Officers - Regulatory reporting
- System Administrators - Device inventory management
Supported Platforms
| Platform | Status |
| Web Dashboard | ✅ Full support |
| CLI | ✅ Full support |
| Linux | ✅ Primary |
| macOS | ✅ Supported |
| Windows (WSL) | ✅ Supported |
| cPanel Hosting | ✅ Documented |
Next: Architecture
Architecture
System Overview
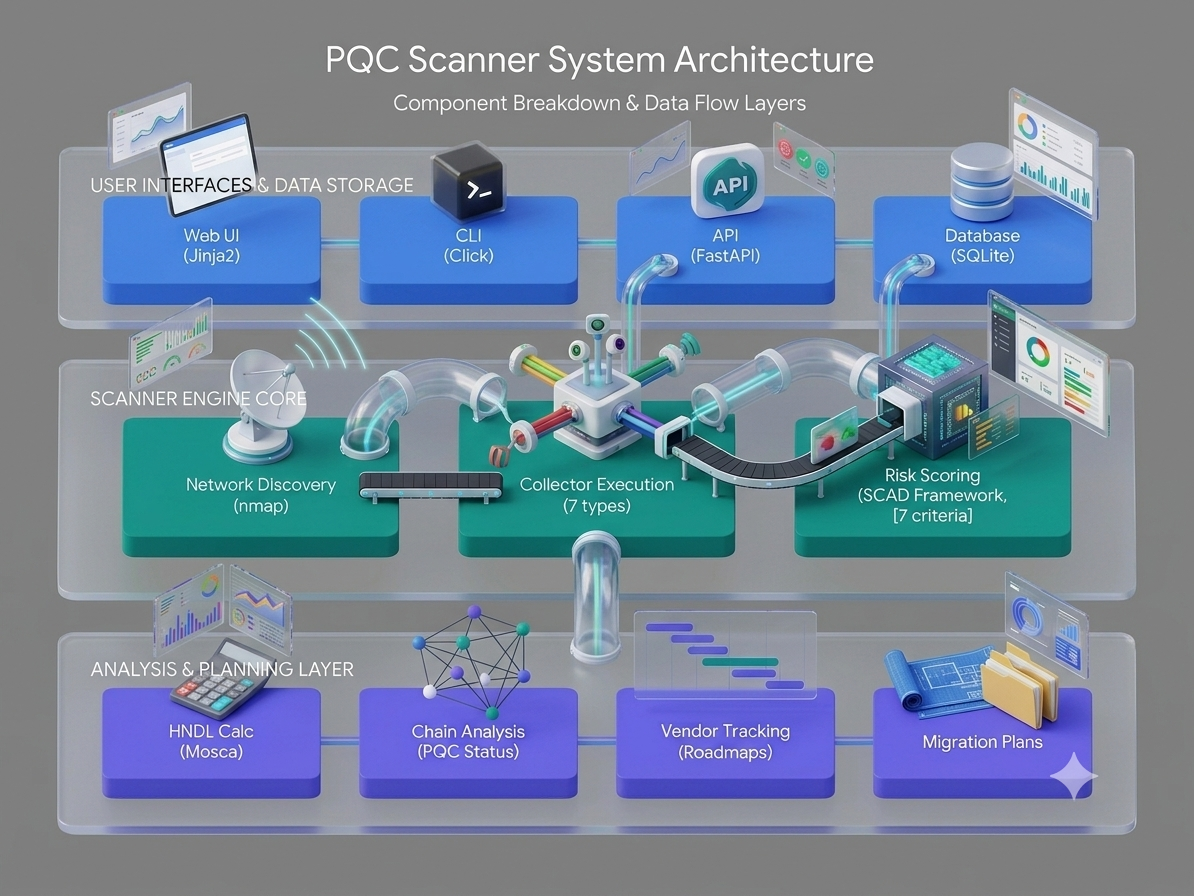 CERIA Architecture Diagram
Data Flow
1. Network Discovery
Target Range → nmap scan → Live hosts → Port detection → Device records
2. Cryptographic Collection
Device + Open Ports → Collector selection → Asset scanning → Crypto assets
3. Risk Analysis
Crypto assets → SCAD scoring → HNDL calculation → Priority ranking
4. Reporting
Prioritized assets → Visualization → Export (PDF/CSV/CBOM)
Collector Types
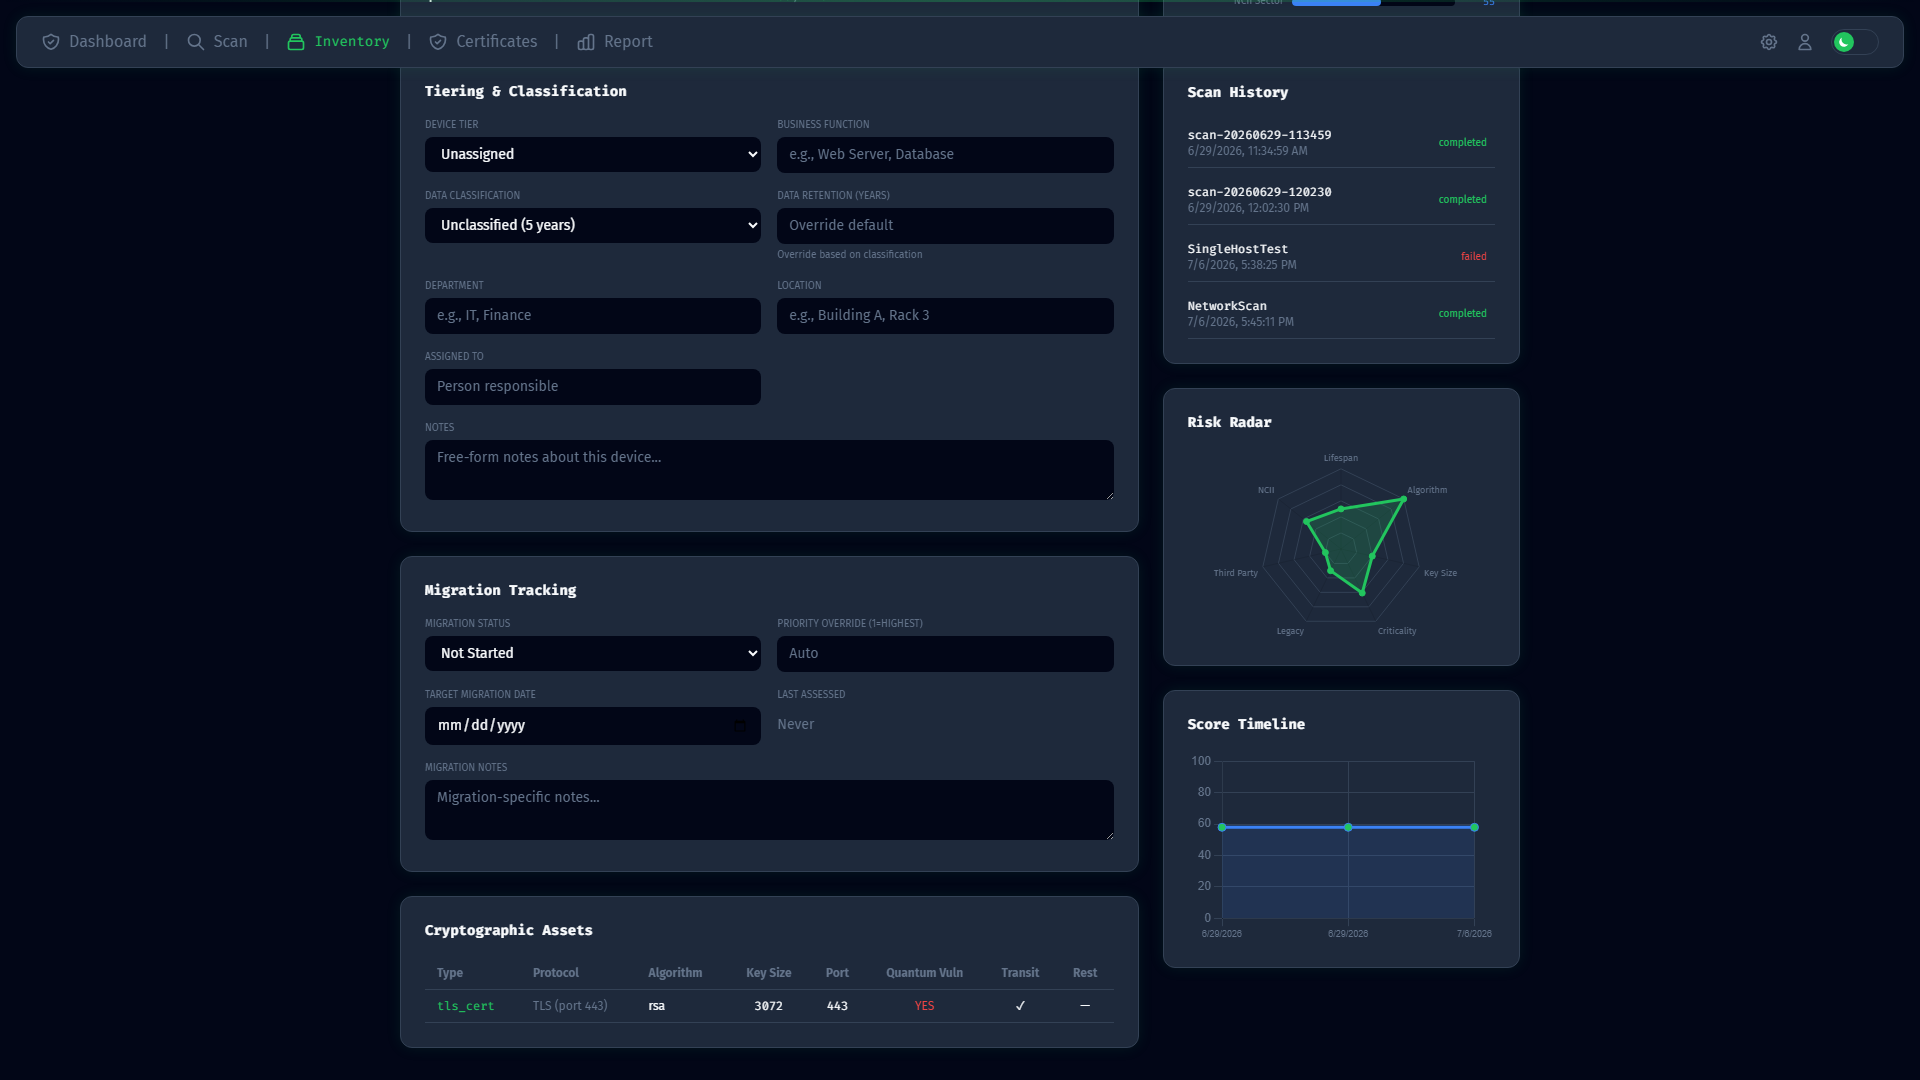 Example: Device showing multiple crypto asset types
| Collector | Port | Protocol | Credential Required |
| TLS/SSL | 443 | HTTPS | No |
| SSH | 22 | SSH | Optional |
| VPN | 500/4500 | IKE/IPSec | No |
| Database | 5432/3306 | Various | Yes |
| OS Crypto | - | SSH | Yes |
| App Config | - | SSH | Yes |
| Cert Store | - | SSH | Yes |
Database Schema
Core Tables
devices- Network devices discoveredcrypto_assets- Cryptographic findingscertificates- X.509 certificatesrisk_scores- Calculated risk scoresscan_sessions- Scan metadatausers- Authentication
Relationships
ScanSession (1) ──▶ (N) Device (1) ──▶ (N) CryptoAsset
                                    ──▶ (N) Certificate
                                     ──▶ (1) RiskScore
Next: Scanning Features
User Manual
Crypto Evaluation & Readiness for Infrastructure Adaptation (Post-Quantum)
Post-Quantum Cryptography Scanner — SCAD Framework Implementation
Table of Contents
- Overview - What is CERIA and why use it
- Architecture - System design and data flow
- CLI Usage - Command-line interface
- Web Dashboard - Web UI walkthrough
- Scanning Features - Network discovery and scanning
- Cryptographic Collectors - 7 collector types
- Risk Scoring - SCAD framework (7 criteria)
- HNDL Calculator - Mosca's Inequality risk
- Certificate Management - Certificate analysis
- Compliance - MySEAL and NCII
- Migration Planning - Step-by-step migration
Overview
CERIA discovers cryptographic assets across your network and prioritizes them for Post-Quantum Cryptography (PQC) migration based on the 7-criterion SCAD Framework.
Main dashboard showing network-wide PQC readiness
Quick Start
New user? Start with the Quick Start Guide for a 5-minute introduction.
Key Features
Cryptographic Discovery
7 Collectors discover cryptographic assets across your network:| Collector | Discovers | Screenshot |
| TLS/SSL | HTTPS certificates, cipher suites | |
| SSH | Host keys, algorithms, banner | |
| VPN | IPsec, SSL-VPN configurations | 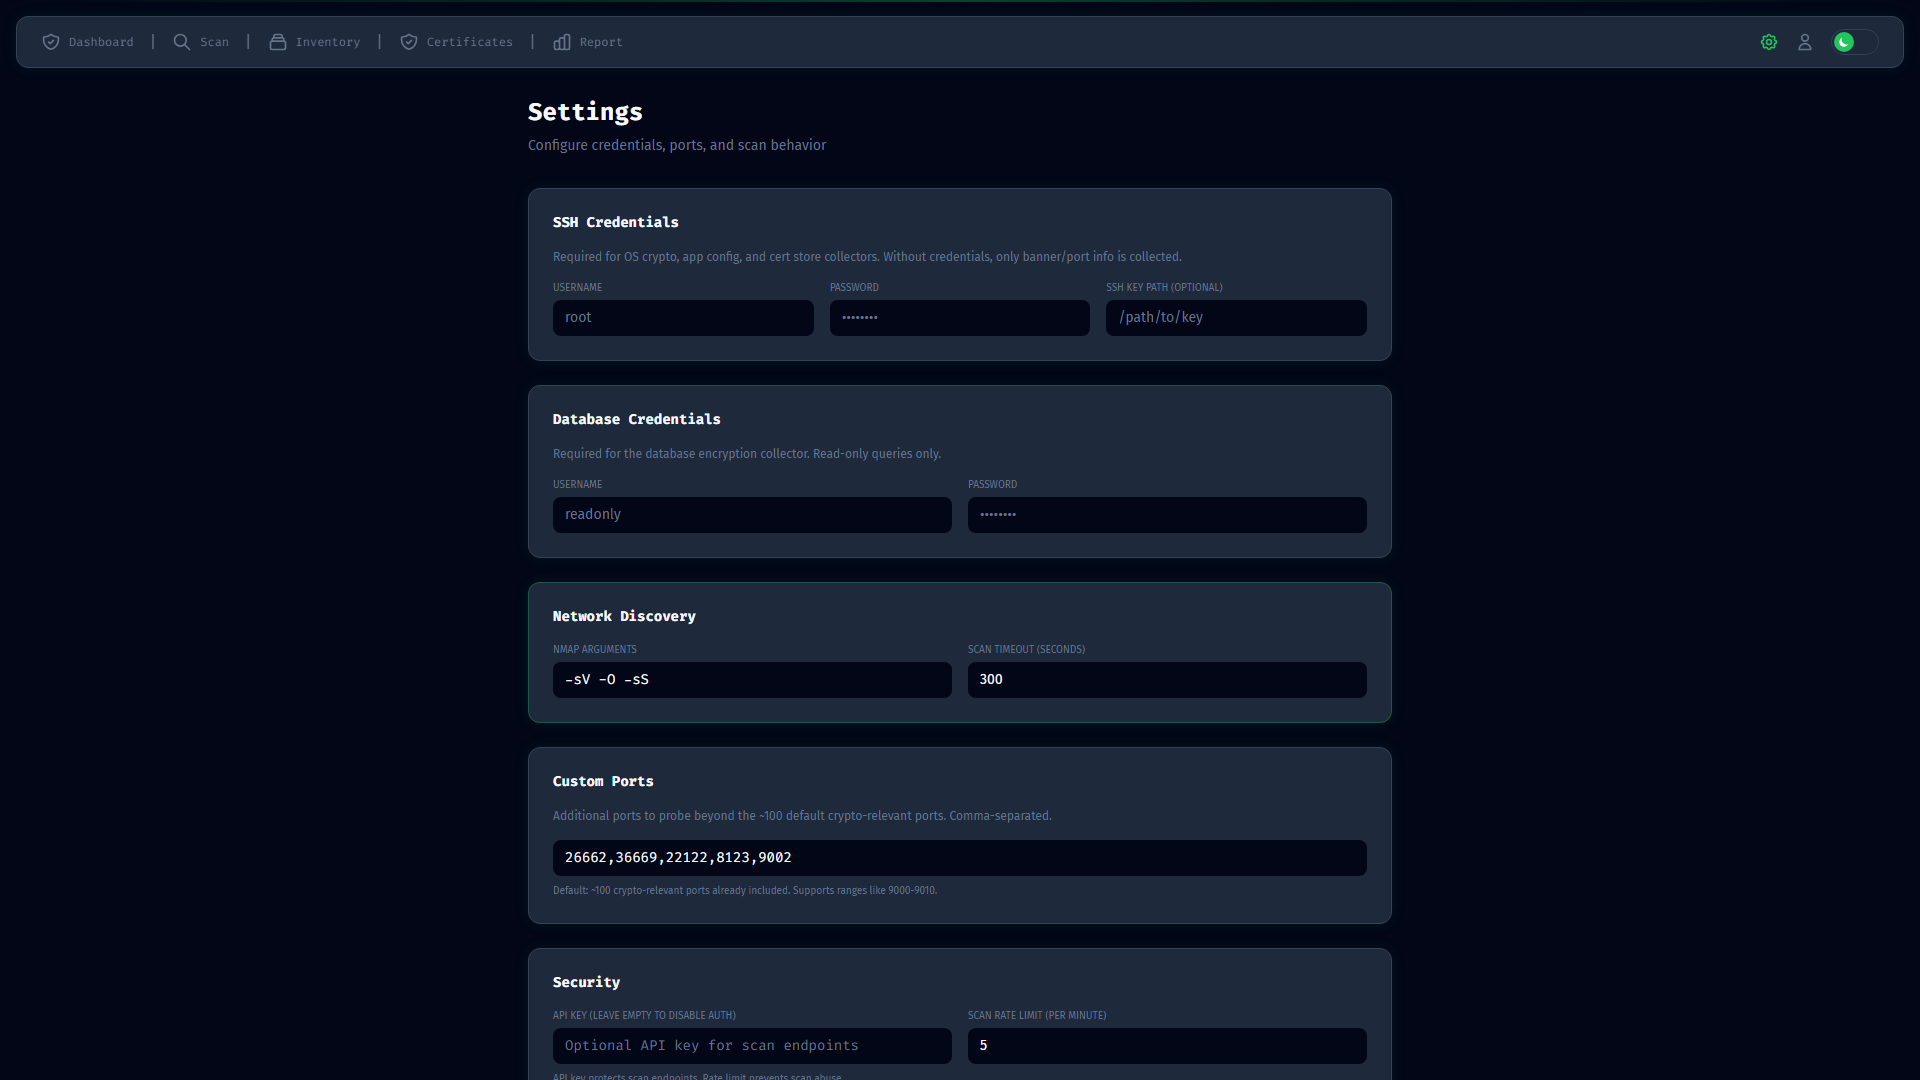 |
| Database | Crypto protocols for DB connections | |
| OS Crypto | Operating system crypto libraries | |
| App Config | Application-specific settings | |
| Certificate Stores | X.509 certificates with chain analysis | |
SCAD Risk Scoring
7-criterion framework with adjustable weights:
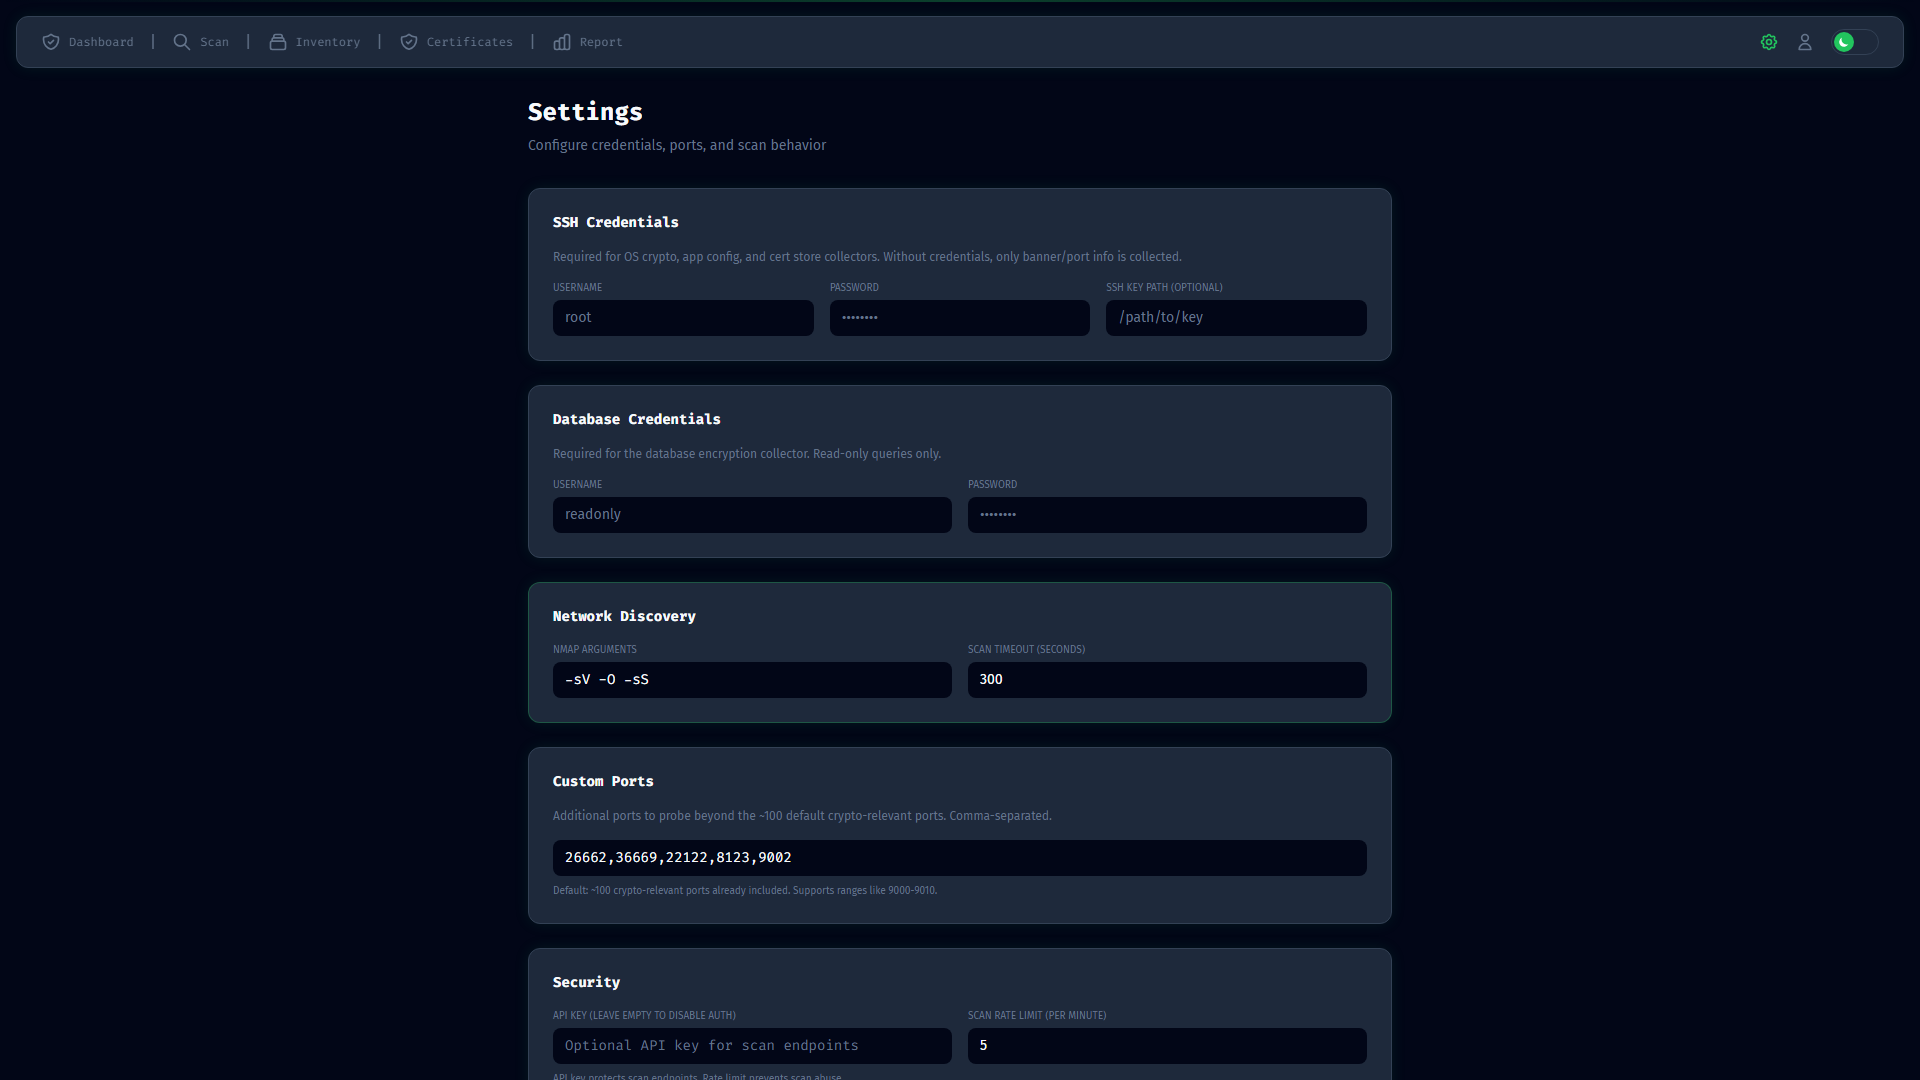 Configure risk scoring weights in Settings
View risk assessment per device:
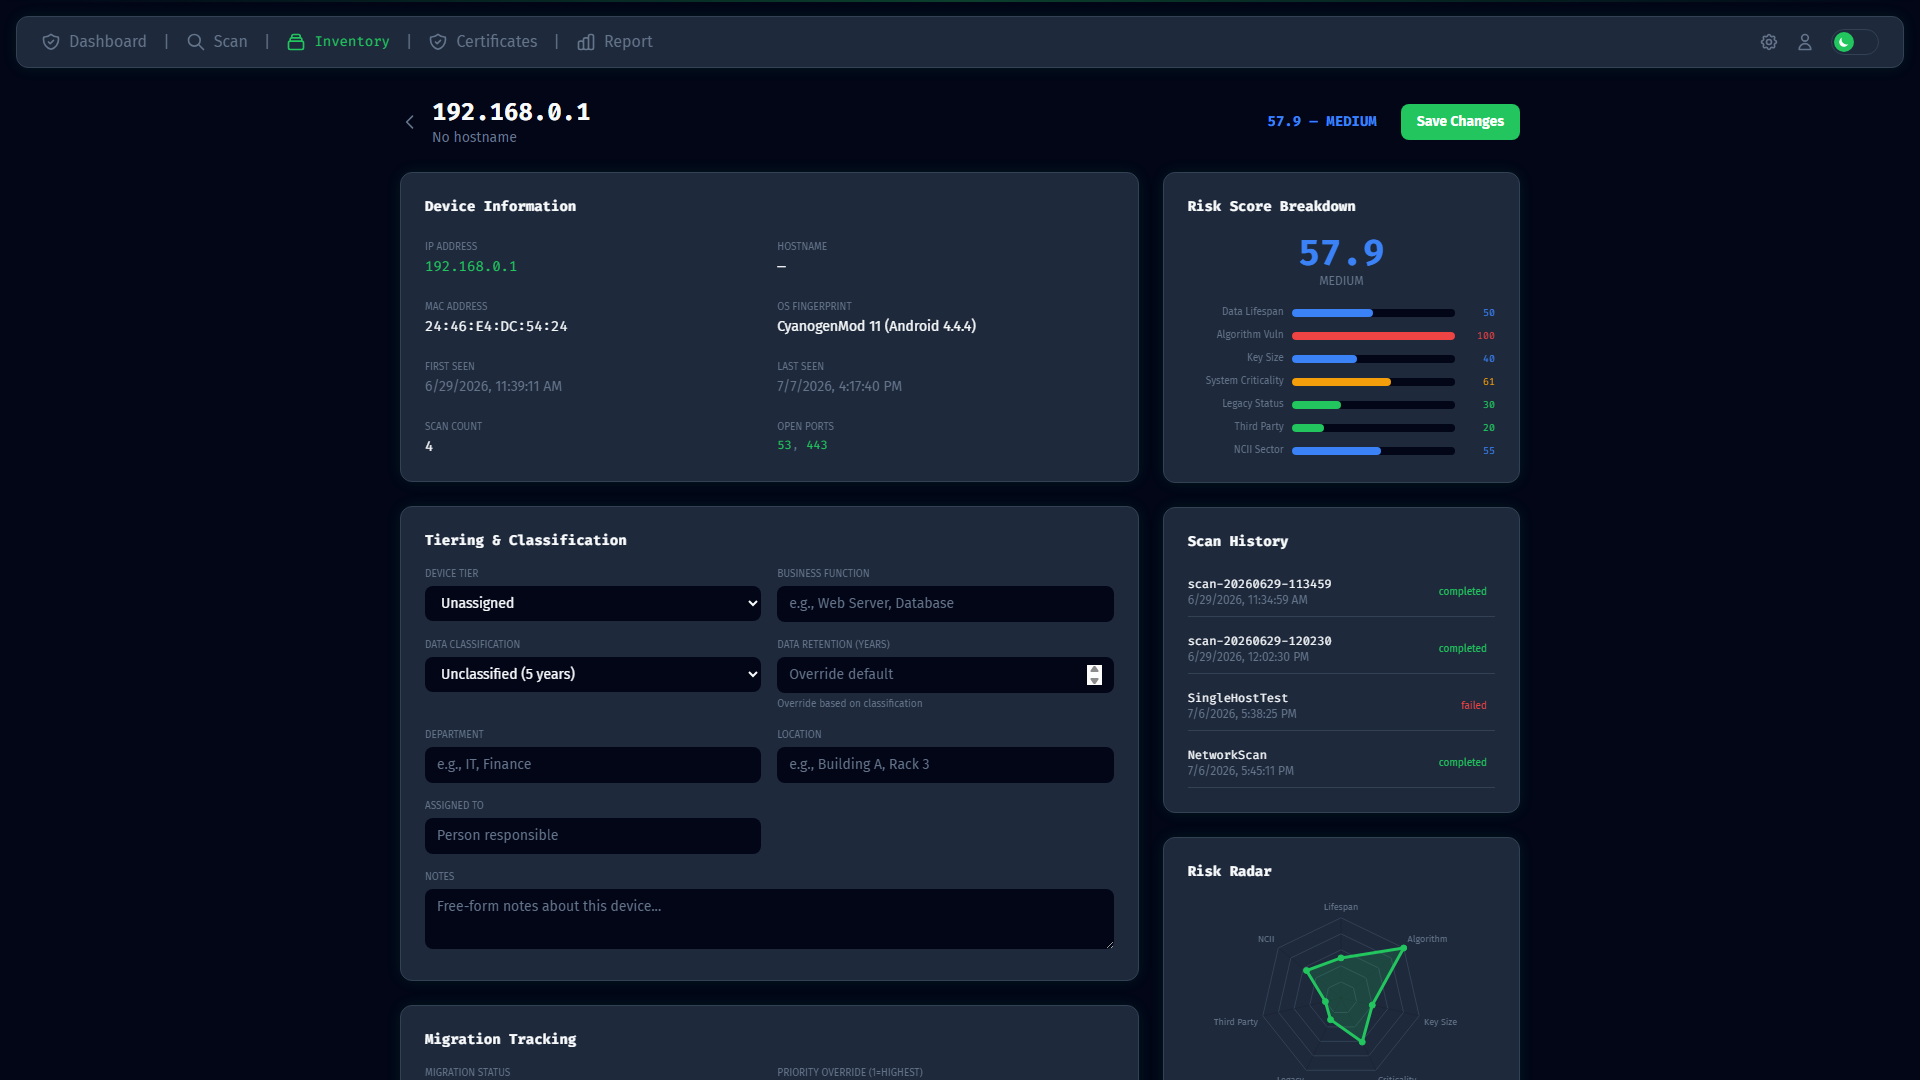 Device detail showing HNDL risk and score breakdown
HNDL Risk Calculator
Mosca's Inequality visualization:
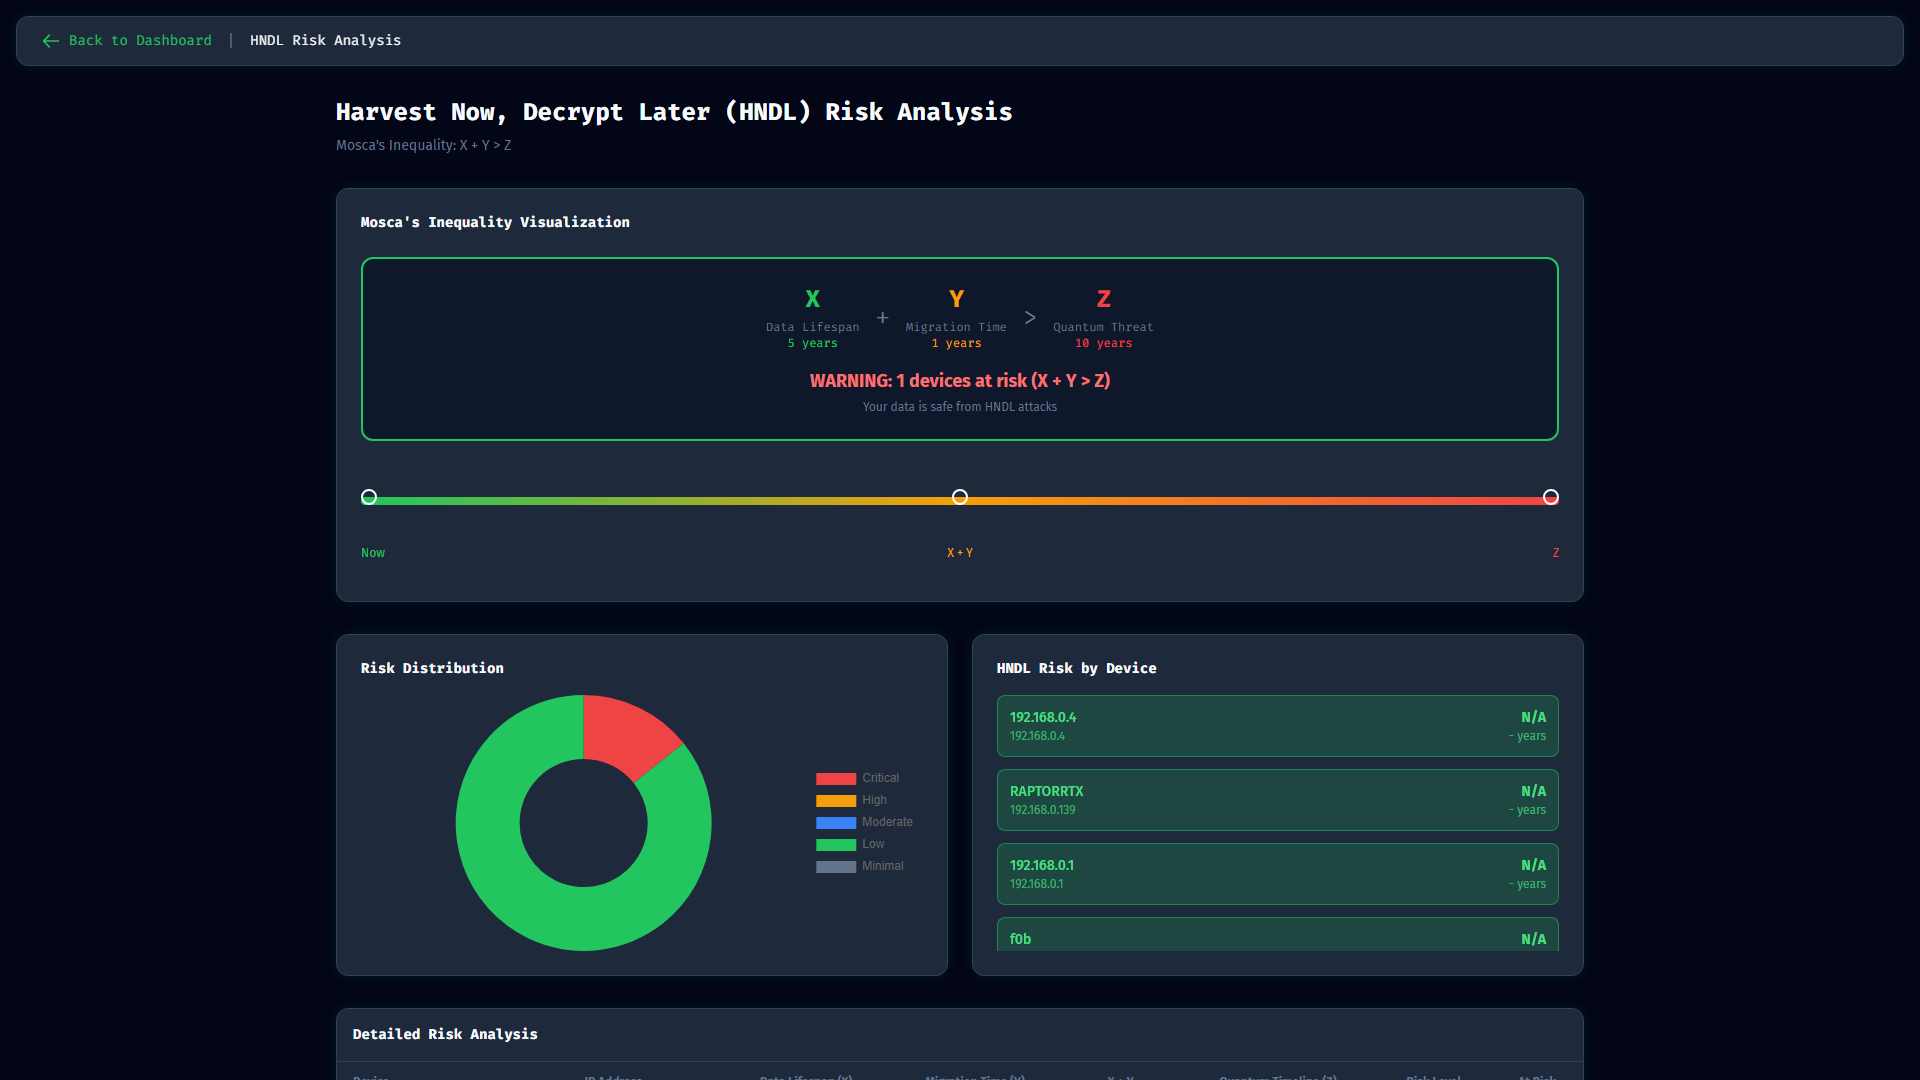 Harvest Now Decrypt Later risk calculator
MySEAL/MyKriptografi Compliance
Malaysia NCII compliance reporting with vendor readiness tracking.
Web Dashboard Features
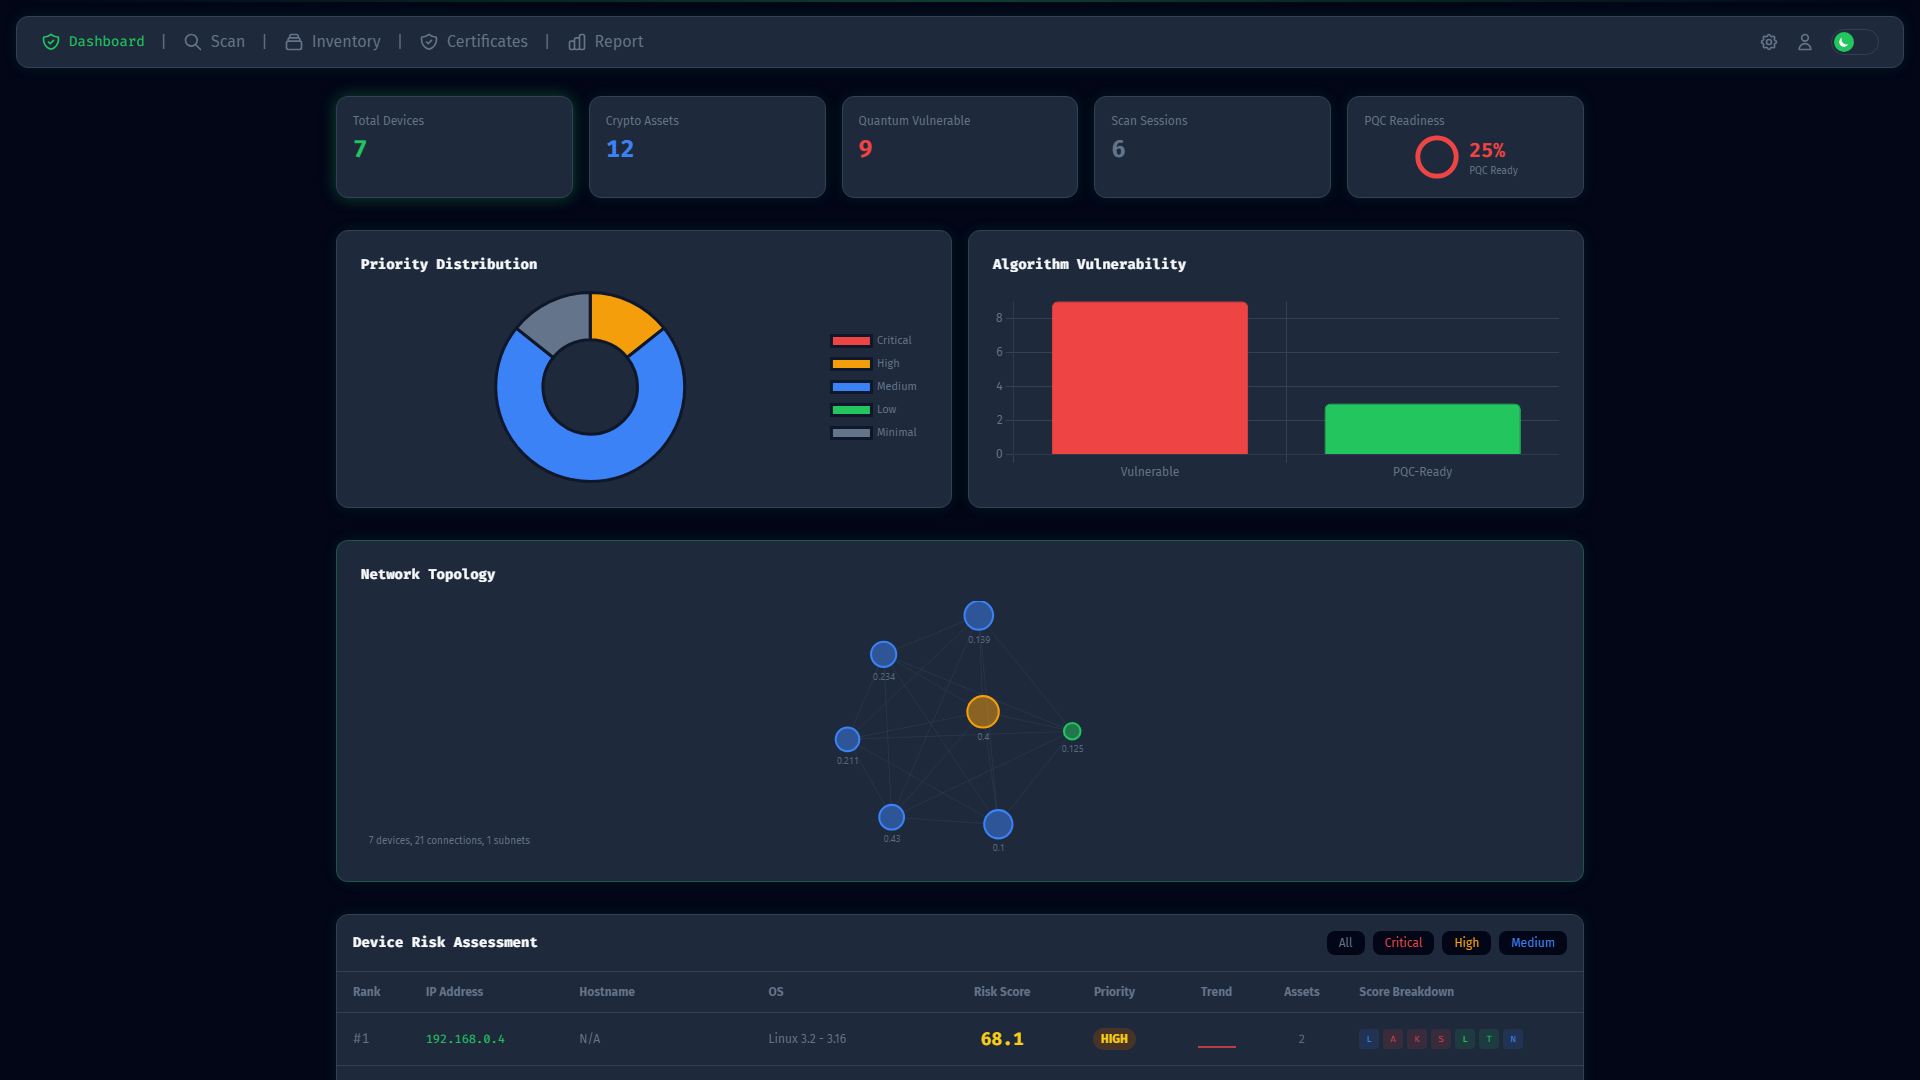
Priority risk cards and device summary
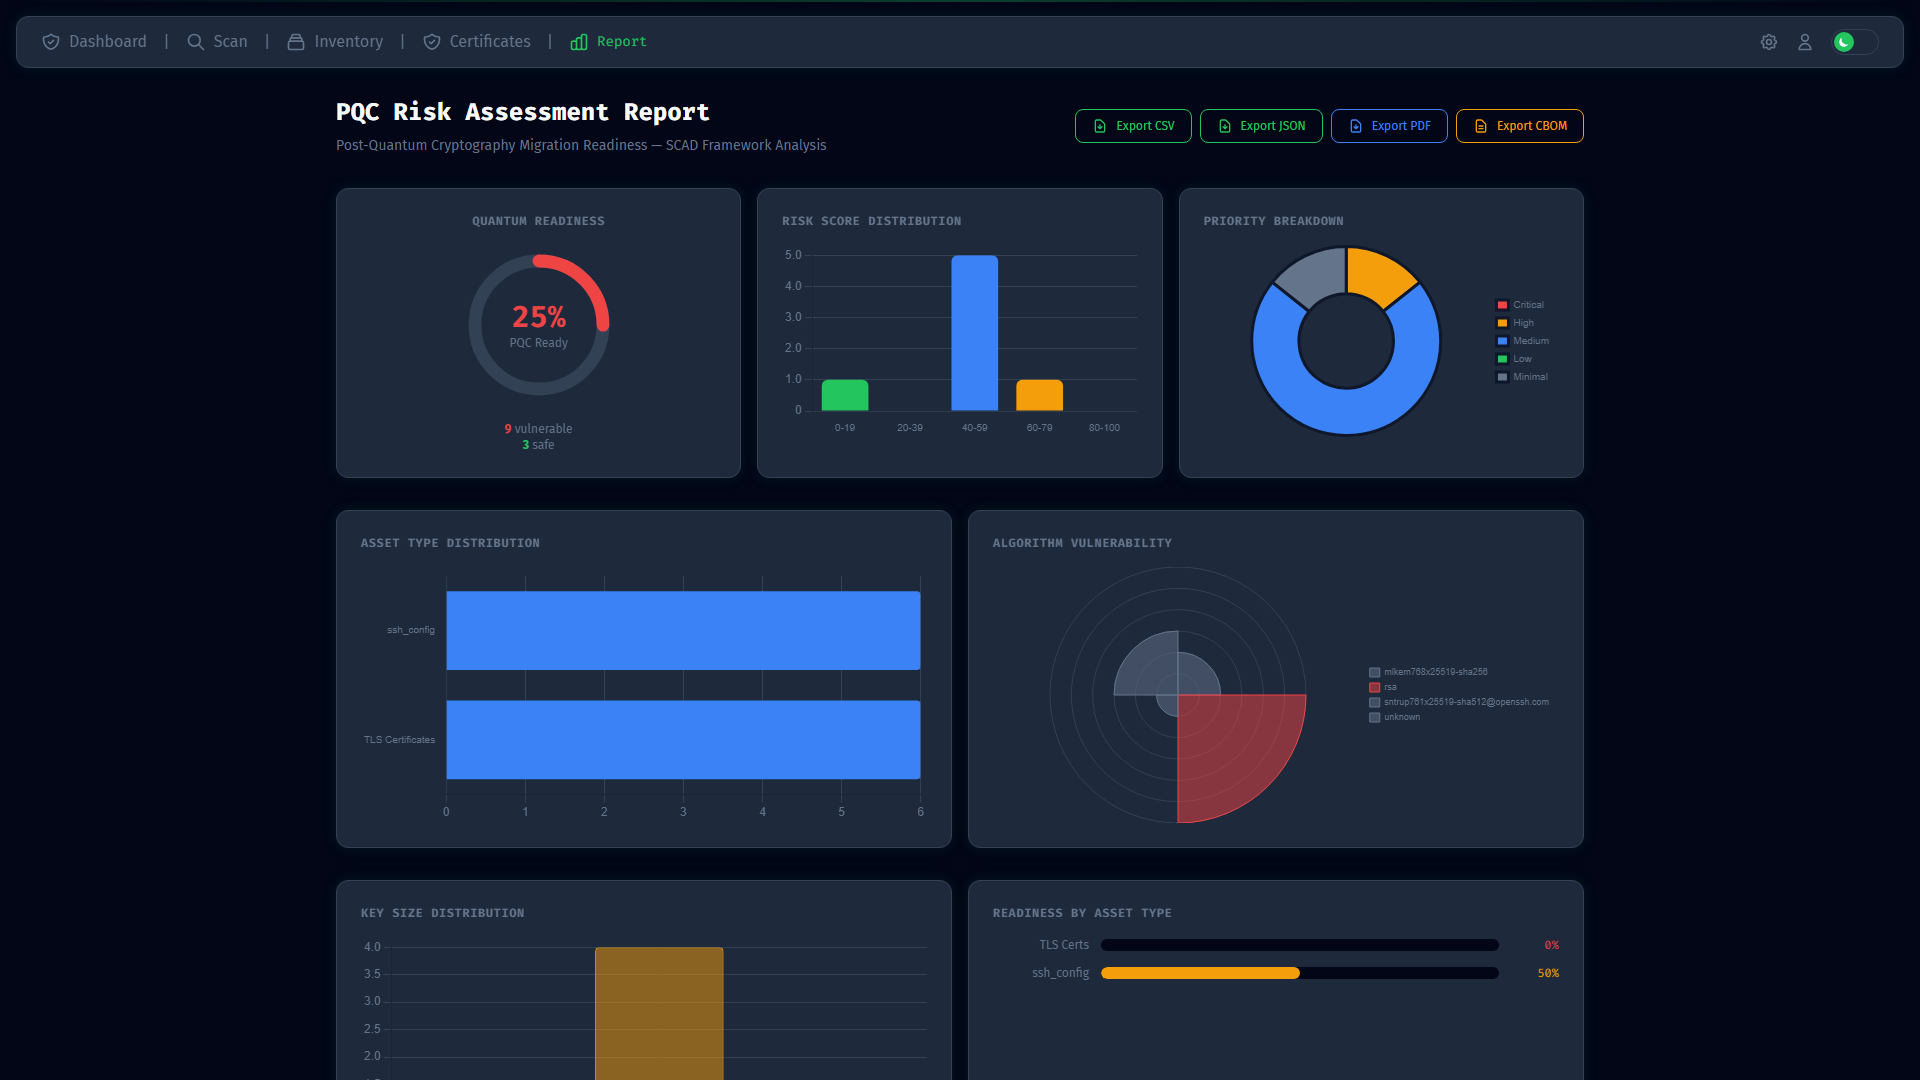 Advanced visualization and analytics
CLI Interface
Full command-line access for automation and scripting:
 CLI dashboard for scripted operations
Technology Stack
- Backend: Python 3.11, FastAPI, SQLAlchemy, SQLite/PostgreSQL
- Frontend: Jinja2 templates, Tailwind CSS, Chart.js, G6 v5
- CLI: Click-based interface
- Scanning: nmap, sslyze, paramiko, cryptography
Visual Guide
See Screenshots Gallery for visual documentation of all features.
Last Updated: 2026-07-10
Web Dashboard
Access
http://localhost:8080 (local)
https://pqcs.dysfunktion.tech (deployed)
Pages
Public Pages
| Page | URL | Description | Screenshot |
| Login | /login | JWT authentication | |
Protected Pages
| Page | URL | Description |
| Dashboard | / | Summary, device table, charts, topology |
| Scan Control | /scan | Configure and run network scans |
| Scan Detail | /scan/{id} | Full scan results with expandable devices |
| Inventory | /inventory | All devices with filters and sorting |
| Device Detail | /inventory/{id} | Device tiering, migration tracking, HNDL |
| Certificates | /certificates | Certificate store with PQC assessment |
| HNDL Detail | /hndl | Harvest Now Decrypt Later risk analysis |
| Report | /report | Visualization: heatmap, timeline, expiry charts |
| Settings | /settings | Credentials, ports, scoring weights, scheduling |
| Profile | /profile | User management, password change |
Dashboard Overview
The main dashboard provides a comprehensive view of your network's PQC readiness:
Main dashboard with device summary, risk distribution, and PQC readiness gauge
Scan Configuration
Configure and start network scans from the Scan Control page:
Scan configuration - select collectors, set target range, and start scanning
Device Management
View all discovered devices in the Inventory:
Device inventory with filtering, sorting, and risk scores
Device Detail View
Deep dive into individual device analysis:
Device detail showing HNDL risk, crypto assets, and score breakdown
Individual cryptographic assets per device
Certificate Management
Browse discovered certificates with PQC status:
Certificate store with PQC assessment and expiry tracking
Reports & Visualization
View risk heatmaps and compliance reports:
Risk heatmap, certificate expiry timeline, and PQC readiness charts
Detailed analytics and reporting visualizations
HNDL Risk Analysis
Access Mosca's Inequality calculator:
Harvest Now Decrypt Later risk analysis dashboard
Settings & Configuration
Configure scanning parameters and scoring weights:
Application settings with SSH credentials, custom ports, and auto-scan scheduling
SCAD risk scoring weights configuration
Risk Priority Dashboard
Monitor critical devices requiring immediate attention:
Risk priority cards highlighting CRITICAL and HIGH priority devices
Navigation
Use the sidebar menu to navigate between pages. The dashboard shows:
- Total devices scanned
- Risk distribution (CRITICAL, HIGH, MEDIUM, LOW, MINIMAL)
- PQC readiness gauge
- Recent scan activity
- Network topology graph
Screenshots
See detailed screenshots in Screenshots Gallery
Quick preview:
- Screenshots Gallery#Dashboard - Main dashboard
- Screenshots Gallery#Scan Control - Scan configuration
- Screenshots Gallery#Device Inventory - Device list
- Screenshots Gallery#HNDL Risk Analysis - HNDL calculator
CLI Usage
Global Options
pqcs [OPTIONS] COMMAND [ARGS]...

Options:
  --db-url TEXT       Database URL (env: DATABASE_URL)
  --verbose, -v       Enable debug logging
  --version           Show version
  --help              Show help
Commands
CLI dashboard view when running ceria dashboard
1. Scan Network
# Basic scan
ceria scan 192.168.1.0/24

# Named scan
ceria scan 192.168.1.0/24 --name "Production Network Scan"

# Specific collectors only
ceria scan 192.168.1.0/24 --collectors tls,ssh,vpn

# All available collectors
ceria scan 192.168.1.0/24 --collectors tls,ssh,vpn,db,os_crypto,app_config,cert_store
tls- TLS/SSL certificates and cipher suitesssh- SSH algorithms and host keysvpn- VPN/IKE configurationdb- Database encryption (TDE)os_crypto- OS certificate storesapp_config- Application crypto configscert_store- Certificate stores
Sample scan output in terminal:
[2026-07-10 10:00:01] INFO: Starting scan: My First Scan
[2026-07-10 10:00:05] INFO: Port scan: Found 24 hosts
[2026-07-10 10:00:12] INFO: TLS collector: 15 certificates collected
[2026-07-10 10:00:18] INFO: SSH collector: 8 SSH servers found
[2026-07-10 10:00:25] INFO: Cert collector: 22 certificates discovered
[2026-07-10 10:00:30] INFO: Scan completed in 29.4s
2. Network Discovery
# Discover hosts without full crypto scan
pqcs discover 192.168.1.0/24 --ports 22,443,8443
3. Generate Reports
# Table format (console)
ceria report --session 1 --format table

# Filter by priority
ceria report --session 1 --priority CRITICAL --format table

# Export to CSV
ceria report --session 1 --format csv --output report.csv

# Export to JSON
ceria report --session 1 --format json --output report.json

# Export to PDF
ceria report --session 1 --format pdf --output report.pdf

# Export CBOM (CycloneDX)
ceria report --session 1 --format cbom --output cbom.json
Sample table output:
IP Address    | Hostname    | Priority  | Algorithms
--------------+-------------+-----------+------------------
192.168.1.10  | web-server  | CRITICAL  | RSA-1024
192.168.1.20  | mail-server | HIGH      | RSA-2048, SHA-1
192.168.1.30  | db-server   | MEDIUM    | RSA-2048
4. List Sessions
pqcs sessions
Output:
ID  | Name                    | Status     | Devices | Started
----+-------------------------+------------+---------+-------------------
1   | My First Scan           | completed  | 24      | 2026-07-10 10:00
2   | Production Network Scan | running    | 12      | 2026-07-10 11:30
5. Launch Dashboard
# Default port 8080
ceria dashboard

# Custom port
ceria dashboard --port 3000 --host 127.0.0.1
Opens web interface at http://localhost:8080 (or your specified port).
Scanning Features
Network Discovery
CERIA uses nmap for initial host discovery:
Discovery Methods
- ARP scan (local network)
- ICMP echo (ping sweep)
- TCP SYN (port probing)
- OS fingerprinting
Port Scanning
Default ports include:
- SSH: 22, 2222
- TLS/HTTPS: 443, 8443, 8080
- VPN: 500, 4500, 1194
- Database: 5432, 1433, 3306
- Mail: 993, 995, 465
- Plus 50+ more
Custom Ports
Add custom ports in Settings:
Format: ports or ranges
Example: 9000,9001,9002-9010,10000
Scanning Modes
Quick Scan
- Basic nmap discovery
- TLS/SSH banner analysis
- Certificate extraction
- Duration: 2-5 minutes
Deep Scan
- Full sslyze analysis
- SSH algorithm enumeration
- IKE probing
- Certificate chain extraction
- Duration: 10-30 minutes
Credential-Based Scan
Requires SSH credentials for:- OS certificate store enumeration
- Application config extraction
- System crypto settings
Scan results showing discovered devices
Scan Scheduling
Automated Re-scans
- Go to Settings
- Enable Automatic Re-scan
- Select frequency:
- Daily - Every day
- Weekly - Selected day
- Monthly - Selected date
- Quarterly - Every 3 months
Drift Detection
Compares scan results over time:
- Algorithm changes
- Certificate updates
- New vulnerabilities
- Configuration drift
Alerts for significant changes.
Scan Performance
Network Size Recommendations
| Network Size | Timeout | Concurrent Hosts |
| /24 (254) | 5 min | 50 |
| /23 (510) | 10 min | 50 |
| /22 (1,022) | 20 min | 50 |
| /16 (65k) | 60 min | 25 |
Tune via Settings page.
See also: Cryptographic Collectors
Risk Scoring
The SCAD (System Cryptographic Asset Demand) Framework uses 7 criteria with adjustable weights (must sum to 100%).
Dashboard View
Risk priority distribution on main dashboard
Configuring Weights
Adjust SCAD framework weights in Settings page
Criteria Descriptions
| Criterion | Weight | Description |
| Algorithm Vulnerability | 25% | Known vulnerabilities in current algorithms |
| Data Lifespan | 20% | How long data must remain confidential |
| Key Size | 15% | RSA key size or ECC curve strength |
| System Criticality | 15% | Importance to business operations |
| Legacy Status | 10% | End-of-life systems harder to migrate |
| Third Party Dependency | 10% | External dependencies affecting migration |
| NCII Sector | 5% | Malaysia NCII sector classification |
Priority Levels
| Score Range | Priority | Action |
| 80-100 | CRITICAL | Immediate migration required |
| 60-79 | HIGH | Plan migration within 6 months |
| 40-59 | MEDIUM | Plan migration within 12 months |
| 20-39 | LOW | Plan migration within 24 months |
| 0-19 | MINIMAL | Track for future migration |
Adjusting Weights
- Go to Settings page
- Modify criterion weights (must sum to 100%)
- Click Save
- Re-run scan to apply new weights
Industry-Specific Configurations
Financial Services
Algorithm Vulnerability: 30%
Data Lifespan: 25%
System Criticality: 20%
Key Size: 10%
Legacy Status: 5%
Third Party: 5%
NCII Sector: 5%
Healthcare
Data Lifespan: 35%
Algorithm Vulnerability: 25%
System Criticality: 15%
Key Size: 10%
Legacy Status: 5%
Third Party: 5%
NCII Sector: 5%
See Screenshots Gallery for more views.
HNDL Calculator
HNDL Overview Dashboard
Harvest Now Decrypt Later summary on dashboard
Mosca's Inequality
Implements Mosca's Inequality: X + Y > Z
Where:
- X = Years data must remain secret (Data Lifespan)
- Y = Years to migrate to PQC (Migration Time)
- Z = Years until quantum computers break current crypto (Q-Day estimate)
Device-Level HNDL Analysis
Mosca's Inequality calculation per device with X+Y vs Z breakdown
Risk Levels
| X+Y vs Z | Risk Level | Recommended Action |
| X+Y >> Z | CRITICAL | Immediate migration |
| X+Y > Z | HIGH | Begin migration now |
| X+Y ≈ Z | MODERATE | Plan within 6 months |
| X+Y < Z | LOW | Plan within 12 months |
| X+Y << Z | MINIMAL | Track and monitor |
Setting Data Retention
- Go to Inventory → Select Device
- Click Edit on tiering section
- Set Data Retention (Years)
- Save changes
HNDL risk auto-recalculates when you update the value.
Examples
Critical Risk Example
Data Retention: 15 years (medical records)
Migration Time: 2 years
Quantum Timeline: 10 years (2035 estimate)

X + Y = 17 > Z = 10
Result: CRITICAL - Data needs protection beyond quantum capability
Low Risk Example
Data Retention: 1 year (temporary cache)
Migration Time: 2 years
Quantum Timeline: 10 years

X + Y = 3 < Z = 10
Result: MINIMAL - Data expires before quantum threat
See Screenshots Gallery for more visuals.
Certificate Management
Certificate Discovery
Automatically extracts and stores X.509 certificates from:
- TLS handshake (port 443, 8443, etc.)
- Certificate files (.pem, .crt, .cer)
- System certificate stores
Certificate inventory with PQC status
Certificate Analysis
For each certificate, CERIA analyzes:
Basic Properties
- Subject/Issuer DN
- Serial number
- Validity period
- Days until expiry
Algorithm Assessment
| Algorithm | PQC Status |
| RSA-2048+ | ⚠️ Vulnerable |
| ECDSA P-256 | ⚠️ Vulnerable |
| ECDSA P-384 | ⚠️ Vulnerable |
| Ed25519 | ✅ PQC Ready |
| Ed448 | ✅ PQC Ready |
| ML-DSA | ✅ PQC Ready |
| ML-KEM | ✅ PQC Ready |
Signature Analysis
- SHA-256 ✅ Good
- SHA-384 ✅ Good
- SHA-1 ⚠️ Weak (deprecated)
- MD5 ❌ Broken (rejected)
Chain Analysis
Root CA (ISRG Root X1)
  └── Intermediate (R3)
       └── Leaf (example.com)
Each level assessed for:
- PQC readiness status
- Hybrid certificate detection
- CA roadmap alignment
Certificate chain detail view
CA Roadmap Database
Tracks vendor PQC transition plans:
| CA Vendor | Current Status | PQC ETA |
| DigiCert | Transitioning | 2025 |
| Let's Encrypt | Transitioning | 2025 |
| Sectigo | Transitioning | 2025 |
| GlobalSign | Planning | 2026 |
| AWS ACM | Ready | Available |
| Azure KV | Ready | Available |
Certificate Actions
Download
- PEM format - Full chain
- Individual - Single certificate
- Chain - CA bundle
Expiry Alerts
Automatic warnings for certificates expiring within:- 90 days (notice)
- 60 days (warning)
- 30 days (critical)
PQC Assessment Report
Generates report showing:- Certificates by PQC status
- Expiry timeline
- Migration priority
- Replacement recommendations
See Screenshots Gallery for certificate views
Compliance
MySEAL Compliance
MySEAL (Malaysia Security Evaluation and Assurance Lab) approved algorithms for government and critical infrastructure.MySEAL Approved Algorithms
Encryption
- AES-128, AES-192, AES-256 (GCM, CBC)
- ChaCha20-Poly1305
Digital Signatures
- RSA-2048+ (transitional)
- ECDSA P-256+ (transitional)
- Ed25519, Ed448 (recommended)
- ML-DSA (PQC-ready)
Key Exchange
- ECDH (transitional)
- X25519, X448 (recommended)
- ML-KEM (PQC-ready)
MySEAL Compliance Check
CERIA checks devices against MySEAL approved algorithms and flags non-compliant crypto.
MyKriptografi NCII Framework
Malaysia's National Critical Information Infrastructure (NCII) requirements for Post-Quantum Cryptography.
PQC Transition Timeline
| Phase | Deadline | Requirements |
| Phase 1 | 2030 | Symmetric crypto migration |
| Phase 2 | 2035 | Asymmetric crypto migration |
NCII Sectors
Priority weighting based on sector:
| Sector | Weight |
| Defense | Critical |
| Finance | Critical |
| Healthcare | Critical |
| Telecom | High |
| Energy | High |
| Government | High |
| Digital Services | Medium |
Compliance Report
Generated report includes:
- Overall compliance percentage
- Non-compliant algorithm list
- Priority remediation list
- Timeline recommendations
Compliance visualization in Reports
NACSA Alignment
National Cyber Security Agency (NACSA) guidelines:
- Crypto Inventory ✅ - Automated discovery
- Risk Assessment ✅ - SCAD scoring
- Migration Plan ✅ - Priority-based roadmap
- Progress Tracking ✅ - Scheduled re-scans
Export Formats
CBOM (CycloneDX)
Cryptographic Bill of Materials in standard format for:- Vendor assessment
- Audit trails
- Compliance documentation
NACSA XML (Future)
Direct NACSA reporting format support planned.See also: Risk Scoring for compliance weighting
Migration Planning
Migration Advisor
CERIA analyzes crypto patterns and generates step-by-step migration plans.
Detected Patterns
Common cryptographic configurations requiring migration:
| Pattern | Current State | Target State |
| rsa-2048-tls | RSA-2048 TLS | ML-KEM/ML-DSA or X25519/Ed25519 |
| rsa-4096-tls | RSA-4096 TLS | PQC algorithms |
| ecdsa-p256-tls | ECDSA P-256 | ML-DSA-65 or Ed25519 |
| ssh-rsa-deprecated | ssh-rsa | rsa-sha2-512 or Ed25519 |
| ssh-ecdsa | ECDSA host keys | Ed25519 host keys |
| vpn-ikev2-rsa | IKEv2 with RSA | IKEv2 with ECDSA or PQC |
Device showing detected crypto patterns
Migration Plan Structure
Each migration plan includes:
1. Current State
- What is currently deployed
- Why it's vulnerable
- Risk assessment
2. Target State
- Recommended replacement
- Algorithm rationale
- Compatibility considerations
3. Migration Steps
Numbered procedures:1. Generate new key pair
2. Create CSR with new algorithm
3. Obtain PQC-ready certificate
4. Configure service to use new cert
5. Test connectivity
6. Schedule cutover
4. Caveats & Risks
Known issues:- Larger certificate sizes
- Increased handshake latency
- Client compatibility concerns
5. Rollback Procedure
How to revert if issues occur.6. Resources
- Official documentation links
- Vendor guides
- NIST recommendations
Dependency Graph
Visualize migration dependencies:
Root CA must migrate first
  → Intermediate CAs
    → Leaf certificates
      → Device configurations
Critical Path Analysis
Identifies the order in which to migrate:
- Root CAs (blocks everything)
- Intermediate CAs (blocks leaf certs)
- High-risk devices (SCAD priority)
- Remaining devices (by tier)
Migration Tracking
Per-device migration status:
| Status | Meaning |
| Not Started | No action taken |
| In Planning | Migration designed |
| Testing | In test environment |
| Scheduled | Production date set |
| Complete | Migrated to PQC |
| Blocked | Dependency pending |
Update status in device detail page.
Migration Timeline
Recommended timeline based on HNDL risk:
| HNDL Risk | Migration Window |
| CRITICAL | Immediate - 3 months |
| HIGH | 3 - 6 months |
| MEDIUM | 6 - 12 months |
| LOW | 12 - 24 months |
| MINIMAL | Track only |
See HNDL Calculator for risk assessment
API Reference
Authentication
Login
POST /api/v1/auth/login
Content-Type: application/json

{
  "username": "string",
  "password": "string"
}
{
  "status": "ok",
  "token": "eyJhbGciOiJIUzI1NiIs...",
  "user": {
    "id": 1,
    "username": "admin",
    "role": "admin"
  }
}
All API endpoints require a JWT token except /auth/login and /auth/register.
Endpoints Overview
Scans
POST /api/v1/scans/start- Start new scanGET /api/v1/scans/{id}/status- Get scan statusGET /api/v1/scans/{id}/results- Get scan resultsPOST /api/v1/scans/{id}/stop- Stop running scan
Devices
GET /api/v1/devices- List all devicesGET /api/v1/devices/{id}- Get device detailsPUT /api/v1/devices/{id}/tiering- Update device tiering
Certificates
GET /api/v1/certificates- List certificatesGET /api/v1/certificates/{id}- Get certificate detailsGET /api/v1/certificates/{id}/download- Download certificate
Analytics
GET /api/v1/analytics/topology- Network topologyGET /api/v1/analytics/risk-heatmap- Risk heatmap dataGET /api/v1/analytics/pqc-readiness- PQC readiness stats
Exports
GET /api/v1/export/{session_id}?format=csv- Export CSVGET /api/v1/export/{session_id}?format=json- Export JSONGET /api/v1/export/{session_id}?format=pdf- Export PDFGET /api/v1/export/{session_id}?format=cbom- Export CBOM
Python Example
import requests

BASE_URL = "https://pqcs.dysfunktion.tech/api/v1"

# Login
resp = requests.post(f"{BASE_URL}/auth/login", json={
    "username": "admin",
    "password": "password"
})
token = resp.json()["token"]
headers = {"Authorization": f"Bearer {token}"}

# Start scan
resp = requests.post(
    f"{BASE_URL}/scans/start",
    headers=headers,
    json={"target_range": "10.0.0.0/24"}
)
session_id = resp.json()["session_id"]

# Export PDF
pdf = requests.get(
    f"{BASE_URL}/export/{session_id}?format=pdf",
    headers=headers
)
open("report.pdf", "wb").write(pdf.content)
Error Codes
| Code | Meaning |
| 400 | Bad Request |
| 401 | Unauthorized |
| 403 | Forbidden |
| 404 | Not Found |
| 409 | Conflict |
| 422 | Unprocessable Entity |
| 429 | Rate Limited |
| 500 | Server Error |
Administration Guide
Complete guide for administering CERIA in production environments.
User Management
User Roles
User configuration and settings access
| Role | Permissions |
| admin | Full access: scans, reports, settings, user management |
| user | Can run scans, view reports, modify device data |
| viewer | Read-only: view scans, reports, cannot modify data |
Creating Users
Via Web Interface
- Login as admin
- Go to Profile → User Management
- Click Add User
- Fill in:
- Username
- Password (8+ characters)
- Role (admin/user/viewer)
- Save
Via CLI Script
import bcrypt
from pqcs.db import init_db, User
from pqcs.config import AppConfig

config = AppConfig()
db = init_db(config.database.url)

# Create user
pw_hash = bcrypt.hashpw(b"newpassword", bcrypt.gensalt())
user = User(
    username="newuser",
    password_hash=pw_hash.decode(),
    role="user",
    is_active=True
)
db.add(user)
db.commit()
print(f"Created: {user.username}")
Disabling Users
- Go to Profile → User Management
- Find the user
- Toggle Active switch to OFF
- User immediately loses access
Password Reset
# Reset via Python
python << 'EOF'
import bcrypt
from pqcs.db import init_db, User
from pqcs.config import AppConfig

config = AppConfig()
db = init_db(config.database.url)

user = db.query(User).filter_by(username="user_to_reset").first()
if user:
    new_pw = bcrypt.hashpw(b"temppassword123", bcrypt.gensalt())
    user.password_hash = new_pw.decode()
    db.commit()
    print("Password reset. User must change on next login.")
EOF
Scan Management
Scheduling Automated Scans
Settings page with scan configuration
- Go to Settings page
- Under Automatic Re-scan section:
- Enable scheduled scans
- Select frequency:
- Daily - Every day at set time
- Weekly - Selected day of week
- Monthly - Selected day of month
- Quarterly - Every 3 months
- Set scan time (24h format)
- Save settings
Managing Running Scans
Check Scan Status
# Via CLI
pqcs sessions

# Via API
curl http://localhost:8080/api/v1/scans/1/status \
  -H "Authorization: Bearer <token>"
Stop a Running Scan
- Go to Scan Detail page
- Click Stop Scan button
- Or via API:
curl -X POST http://localhost:8080/api/v1/scans/1/stop \
  -H "Authorization: Bearer <token>"
Delete Old Scans
# Delete scans older than 90 days
from pqcs.db import init_db, ScanSession
from pqcs.config import AppConfig
from datetime import datetime, timedelta

config = AppConfig()
db = init_db(config.database.url)

cutoff = datetime.utcnow() - timedelta(days=90)
old_scans = db.query(ScanSession).filter(
    ScanSession.finished_at < cutoff
).all()

for scan in old_scans:
    print(f"Deleting: {scan.name}")
    db.delete(scan)

db.commit()
print(f"Deleted {len(old_scans)} scans")
Scan Optimization
Configure scan timeouts and rate limits
Custom Ports
Add custom ports in Settings:
Format: individual ports or ranges
Example: 9000,9001,9002-9010,10000
Scan Timeouts by Network Size
| Network Size | Recommended Timeout |
| /24 (254 hosts) | 300 seconds (5 min) |
| /23 (510 hosts) | 600 seconds (10 min) |
| /22 (1022 hosts) | 1200 seconds (20 min) |
| /16 (65534 hosts) | 3600 seconds (60 min) |
Database Administration
Database Location
Default SQLite database paths:
- Development:
./pqcs.db - Production:
/home2/yusricom/db/pqcs.db(cPanel) - Custom: Set via
DATABASE_URLenv var
Direct Database Access
# Connect via SQLite CLI
sqlite3 /home2/yusricom/db/pqcs.db

# Common queries
.tables
.schema devices
SELECT COUNT(*) FROM devices;
SELECT * FROM scan_sessions ORDER BY started_at DESC LIMIT 5;
.quit
Database Maintenance
Monitor database growth with regular maintenance
Vacuum (Reclaim Space)
# Removes deleted data and shrinks file
sqlite3 /home2/yusricom/db/pqcs.db "VACUUM;"
Analyze (Performance)
# Update query planner statistics
sqlite3 /home2/yusricom/db/pqcs.db "ANALYZE;"
Check Integrity
# Verify database is not corrupted
sqlite3 /home2/yusricom/db/pqcs.db "PRAGMA integrity_check;"
PostgreSQL Migration (Advanced)
# Install PostgreSQL adapter
pip install psycopg2-binary

# Export SQLite
sqlite3 pqcs.db .dump > dump.sql

# Import to PostgreSQL
psql -U postgres -d pqcs < dump.sql

# Update connection string
export DATABASE_URL="postgresql://user:pass@localhost/pqcs"
Configuration Management
Settings Storage
Settings stored in database table settings:
{
    "scan_rate_limit": "5",
    "default_scan_timeout": "300",
    "nmap_args": "-sV -O -sS",
    "ssh_username": "",
    "custom_ports": "",
}
Updating Settings
Via API
# Update single setting
curl -X PUT http://localhost:8080/api/v1/settings/scan_rate_limit \
  -H "Authorization: Bearer <token>" \
  -H "Content-Type: application/json" \
  -d '{"value": "10"}'

# Get all settings
curl http://localhost:8080/api/v1/settings \
  -H "Authorization: Bearer <token>"
Via Environment Variables
Priority order (highest first):
- Environment variables (
.env) - Database settings
- Default values
Risk Scoring Configuration
Adjust SCAD framework criterion weights
Understanding SCAD Weights
Default configuration (must sum to 100%):
| Criterion | Default | When to Increase |
| Algorithm Vulnerability | 25% | Known CVEs, weak algorithms |
| Data Lifespan | 20% | Long-term sensitive data |
| Key Size | 15% | Large RSA keys (>2048) |
| System Criticality | 15% | Business-critical systems |
| Legacy Status | 10% | EOL systems |
| Third Party Dependency | 10% | Vendor-managed crypto |
| NCII Sector | 5% | Regulated industries |
Recalculating Scores
After changing weights, rescore existing devices:
from pqcs.scoring.engine import ScoringEngine
from pqcs.db import init_db, Device
from pqcs.config import AppConfig

config = AppConfig()
db = init_db(config.database.url)
scoring = ScoringEngine(config.scoring, config.ncii_sector)

devices = db.query(Device).all()
for device in devices:
    score = scoring.calculate(device, device.assets)
    # Update in database
    print(f"{device.ip_address}: {score.overall_score}")

db.commit()
Monitoring & Alerts
Health Check Endpoint
# Basic health check
curl http://localhost:8080/health

# Expected response:
{
  "status": "ok",
  "timestamp": "2026-07-10T12:00:00",
  "version": "0.1.0",
  "database": "connected"
}
Log Monitoring
| Pattern | Meaning | Action |
scan completed | Normal | None |
collector error | Scan issue | Check collector config |
database error | DB issue | Check connectivity |
authentication failed | Login attempt | Review if suspicious |
rate limit exceeded | Too many scans | Adjust thresholds |
Log Rotation
Add to /etc/logrotate.d/pqcs:
/opt/pqcs/logs/*.log {
    daily
    rotate 30
    compress
    delaycompress
    missingok
    notifempty
    create 644 pqcs pqcs
}
Maintenance Tasks
Daily Tasks
- [ ] Check scan completion status
- [ ] Review failed scans
- [ ] Monitor disk space (database growth)
Weekly Tasks
Review certificate expiry weekly
- [ ] Review new high-priority devices
- [ ] Check certificate expiry (30-day warning)
- [ ] Verify backups
- [ ] Review user access log
Monthly Tasks
- [ ] Database optimization (VACUUM)
- [ ] Archive old scan data (>90 days)
- [ ] Update algorithm databases
- [ ] Review and adjust scoring weights
- [ ] Security audit of user accounts
Quarterly Tasks
- [ ] Full system backup test
- [ ] Disaster recovery drill
- [ ] Update dependencies
- [ ] Review vendor roadmaps
Backup & Recovery
Automated Daily Backup
#!/bin/bash
# /opt/pqcs/backup.sh

DATE=$(date +%Y%m%d_%H%M%S)
BACKUP_DIR="/backups/pqcs"
SOURCE_DB="/home2/yusricom/db/pqcs.db"

# Create backup dir
mkdir -p $BACKUP_DIR

# Backup database
cp $SOURCE_DB "$BACKUP_DIR/pqcs_$DATE.db"

# Compress
gzip "$BACKUP_DIR/pqcs_$DATE.db"

# Backup configuration
tar czf "$BACKUP_DIR/config_$DATE.tar.gz" \
  /opt/pqcs/.env

# Upload to S3 (optional)
# aws s3 cp "$BACKUP_DIR/pqcs_$DATE.db.gz" s3://pqcs-backups/

# Keep only last 30 days
find $BACKUP_DIR -name "*.gz" -mtime +30 -delete

echo "Backup completed: pqcs_$DATE.db.gz"
Crontab entry:
0 2 * * * /opt/pqcs/backup.sh >> /var/log/pqcs/backup.log 2>&1
Recovery Procedures
Scenario 1: Database Corruption
# Stop application
sudo systemctl stop pqcs

# Restore from backup
sudo cp /backups/pqcs/pqcs_20260701_020000.db \
  /home2/yusricom/db/pqcs.db
sudo chown yusricom:yusricom /home2/yusricom/db/pqcs.db

# Restart
sudo systemctl start pqcs
Scenario 2: Complete Server Failure
# On new server

# 1. Install CERIA
pip install -e .

# 2. Restore database
mkdir -p /home2/yusricom/db
cp /backups/pqcs/pqcs_latest.db /home2/yusricom/db/pqcs.db

# 3. Restore config
cp /backups/pqcs/.env /opt/pqcs/.env

# 4. Set permissions
chown -R pqcs:pqcs /home2/yusricom/db /opt/pqcs

# 5. Start service
systemctl start pqcs
Troubleshooting
Database Locked
# Find and kill blocking process
fuser /home2/yusricom/db/pqcs.db

# Or wait for timeout
Scan Stuck
# Check if nmap is running
ps aux | grep nmap

# Kill hanging nmap
sudo pkill -9 nmap
High Memory Usage
# Limit concurrent hosts
export MAX_CONCURRENT_HOSTS=25

# Or use smaller subnets
ceria scan 192.168.1.0/25  # instead of /24
Cannot Access Dashboard
| Symptom | Solution |
| 403 Forbidden | Check file permissions |
| 500 Error | Check Passenger/Application logs |
| Not loading | Verify firewall/port settings |
| Cookie error | Clear browser cache |
Related Documentation
- Deployment Guide - Production setup
- Scanning Features - Scan configuration
- Risk Scoring - SCAD framework details
Last Updated: 2026-07-10
Deployment Guide
Complete guide for deploying CERIA in production environments.
cPanel Shared Hosting (Production) ⭐
This is the current deployment method for https://pqcs.dysfunktion.tech.
Prerequisites
- cPanel with Python support
- SSH access enabled
- Python 3.10+ available
Files Required
| File | Purpose |
passenger_wsgi.py | WSGI entry point for Passenger |
requirements.txt | Python dependencies |
pqcs/ | Application code directory |
.htaccess | Apache configuration |
Step 1: Upload Files
Upload project files to:
/home/username/public_html/pqcs.example.com/
pqcs.example.com/
├── passenger_wsgi.py
├── requirements.txt
├── .htaccess
└── pqcs/
    ├── __init__.py
    ├── web/
    ├── scanner/
    └── ...
Step 2: Configure .htaccess
Create .htaccess in application root:
PassengerPython /home/username/virtualenv/pqcs/3.11/bin/python
PassengerAppRoot /home/username/public_html/pqcs.example.com
PassengerAppType wsgi
PassengerStartupFile passenger_wsgi.py
Step 3: Setup Python App in cPanel
- Login to cPanel
- Go to Setup Python App (usually under Software section)
- Click Create Application
The cPanel interface for creating a Python application
- Configure the following settings:
- Python version: 3.11
- Application root:
public_html/pqcs.example.com - Application URL:
pqcs.example.com - Application startup file:
passenger_wsgi.py - Application Entry point:
application
- Click Create
Your app should now show in cPanel as "Running":
Successfully deployed application running on cPanel
Step 4: Install Dependencies
SSH into server:
cd /home/username/public_html/pqcs.example.com

# Activate virtual environment
source /home/username/virtualenv/pqcs/3.11/bin/activate

# Install dependencies
pip install -r requirements.txt

# Create database directory outside web root
mkdir -p /home/username/db
chmod 755 /home/username/db
Step 5: Initialize Database
# Run in virtual environment
python << 'EOF'
import sys
sys.path.insert(0, '/home/username/public_html/pqcs.example.com')
from pqcs.db import init_db
init_db('sqlite:////home/username/db/pqcs.db')
print("Database initialized")
EOF
Step 6: Environment Variables
In cPanel > Setup Python App > Environment Variables, add:
| Variable | Value | Description |
SECRET_KEY | openssl rand -hex 32 | JWT signing key |
DATABASE_URL | sqlite:////home/username/db/pqcs.db | Database path |
Step 7: Restart Application
cd /home/username/public_html/pqcs.example.com
mkdir -p tmp
touch tmp/restart.txt
Step 8: Verify Deployment
Visit https://pqcs.example.com and you should see:
Login page - confirmation that the app is successfully deployed
Login with your admin credentials (default: admin/admin on first run):
Enter credentials to access the dashboard
After login, verify the dashboard loads correctly:
Dashboard shows device summary and risk distribution
Test the Settings page to ensure database is working:
Settings page confirms database connection is active
Check the Inventory page shows device management:
Device inventory loads successfully
If all pages load without errors, your deployment is complete! 🎉
Troubleshooting cPanel
If you encounter issues during deployment, check the following:
| Issue | Solution | Visual Indicator |
| 403 Forbidden | Check permissions: chmod 644 .htaccess passenger_wsgi.py | Browser shows "403 Forbidden" |
| 500 Internal Error | Check Passenger log in cPanel > Logs | Browser shows "500 Internal Server Error" |
| Application not found | Verify passenger_wsgi.py exists and application variable is set | cPanel shows app as "Stopped" |
| Database not found | Use absolute path in DATABASE_URL | "OperationalError: unable to open database file" in logs |
| Import errors | Run pip install in correct virtualenv | "ModuleNotFoundError" in Passenger log |
Common Deployment Errors
Error: "Incomplete response received from application"- Check
passenger_wsgi.pyfor syntax errors - Verify all Python files were uploaded correctly
- Check Passenger log for stack traces
# Create database directory outside web root
mkdir -p /home/username/db
chmod 755 /home/username/db
# Update DATABASE_URL to:
# sqlite:////home/username/db/pqcs.db
- Ensure
SECRET_KEYenvironment variable is set - Check
bcryptandpyjwtare installed:pip list | grep -E 'bcrypt|PyJWT'
- The
passenger_wsgi.pymust expose anapplicationvariable - Make sure the WSGIWrapper is correctly wrapping the FastAPI app
# Always restart the app after modifying Python files
cd /home/username/public_html/pqcs.example.com
touch tmp/restart.txt
If problems persist, check the detailed logs in cPanel under Logs > Error Logs.
passenger_wsgi.py Template
#!/usr/bin/env python3
import os
import sys

APP_ROOT = "/home/username/public_html/pqcs.example.com"
sys.path.insert(0, APP_ROOT)
os.chdir(APP_ROOT)

# Use database outside web root
DB_PATH = "/home/username/db/pqcs.db"
os.environ['DATABASE_URL'] = f'sqlite:///{DB_PATH}'

from pqcs.web.app import create_app
from pqcs.config import AppConfig

config = AppConfig()
config.database.url = f'sqlite:///{DB_PATH}'

asgi_app = create_app(config)

# WSGI wrapper for FastAPI
import asyncio

class WSGIWrapper:
    def __init__(self, asgi_app):
        self.asgi_app = asgi_app

    def __call__(self, environ, start_response):
        scope = {
            'type': 'http',
            'asgi': {'version': '3.0'},
            'method': environ.get('REQUEST_METHOD', 'GET'),
            'scheme': environ.get('wsgi.url_scheme', 'https'),
            'path': environ.get('PATH_INFO', '/'),
            'query_string': environ.get('QUERY_STRING', '').encode(),
            'headers': [],
            'server': (environ.get('SERVER_NAME', 'localhost'),
                      int(environ.get('SERVER_PORT', 443))),
            'client': (environ.get('REMOTE_ADDR', '127.0.0.1'),
                      int(environ.get('REMOTE_PORT', 0) or 0)),
        }

        body = b''
        if 'wsgi.input' in environ:
            cl = environ.get('CONTENT_LENGTH')
            if cl:
                try:
                    body = environ['wsgi.input'].read(int(cl))
                except:
                    pass

        messages = []

        async def receive():
            return {'type': 'http.request', 'body': body, 'more_body': False}

        async def send(message):
            messages.append(message)

        loop = asyncio.new_event_loop()
        try:
            asyncio.set_event_loop(loop)
            loop.run_until_complete(self.asgi_app(scope, receive, send))

            start_msg = next(m for m in messages if m['type'] == 'http.response.start')
            status = f"{start_msg['status']}"
            headers = [(k.decode() if isinstance(k, bytes) else k,
                       v.decode() if isinstance(v, bytes) else v)
                      for k, v in start_msg.get('headers', [])]
            start_response(status, headers)

            body_parts = [m.get('body', b'') for m in messages
                         if m['type'] == 'http.response.body']
            return body_parts if body_parts else [b'']
        finally:
            loop.close()

application = WSGIWrapper(asgi_app)
Docker Deployment
Dockerfile
FROM python:3.11-slim

# Install system dependencies
RUN apt-get update && apt-get install -y \
    nmap libpq-dev \
    && rm -rf /var/lib/apt/lists/*

WORKDIR /app

COPY requirements.txt .
RUN pip install --no-cache-dir -r requirements.txt

COPY . .
RUN pip install -e .

RUN mkdir -p /data /logs

ENV DATABASE_URL=sqlite:////data/pqcs.db
ENV DASHBOARD_HOST=0.0.0.0
ENV DASHBOARD_PORT=8080
ENV PYTHONUNBUFFERED=1

EXPOSE 8080

CMD ["pqcs", "dashboard", "--host", "0.0.0.0", "--port", "8080"]
docker-compose.yml
version: '3.8'

services:
  pqcs:
    build: .
    container_name: pqcs
    ports:
      - "8080:8080"
    volumes:
      - ./data:/data
      - ./logs:/logs
    environment:
      - SECRET_KEY=${SECRET_KEY}
      - DATABASE_URL=sqlite:////data/pqcs.db
    restart: unless-stopped
Build and Run
# Generate a secure secret key
export SECRET_KEY=$(openssl rand -hex 32)

# Create directories for persistent data
mkdir -p data logs

# Build and start the container
docker-compose up -d --build

# Verify the container is running
docker ps | grep pqcs

# View application logs
docker-compose logs -f pqcs
Expected output after successful startup:
[INFO] Starting CERIA Web Dashboard
[INFO] Database initialized
[INFO] Uvicorn running on http://0.0.0.0:8080
Access the application at http://localhost:8080. You should see the login page similar to the production deployment:
Note: The Docker deployment uses the same codebase as cPanel, so all features (dashboard, scans, reports) work identically.
Stopping the Container
docker-compose down

# To also remove volumes (WARNING: deletes all data)
docker-compose down -v
Ubuntu Server Deployment
System Requirements
- Python 3.10+
- 2GB RAM minimum
- 10GB disk space
- nmap installed
- SSL certificate
Installation
# Install system dependencies
sudo apt-get update
sudo apt-get install -y python3 python3-pip python3-venv nmap openssl

# Create dedicated user for security
sudo useradd -r -s /bin/false pqcs

# Create directory structure
sudo mkdir -p /opt/pqcs /var/lib/pqcs /var/log/pqcs
sudo chown -R pqcs:pqcs /opt/pqcs /var/lib/pqcs /var/log/pqcs

# Clone and setup application
# Option A: Clone from repository
sudo -u pqcs git clone https://github.com/yourusername/pqcs.git /opt/pqcs

# Option B: Upload files via SCP/FTP
# scp -r /local/pqcs/* pqcs@server:/opt/pqcs/

# Setup Python virtual environment
cd /opt/pqcs
sudo -u pqcs python3 -m venv venv
sudo -u pqcs venv/bin/pip install --upgrade pip
sudo -u pqcs venv/bin/pip install -e .

# Create environment configuration
sudo -u pqcs tee /opt/pqcs/.env << 'EOF'
SECRET_KEY=$(openssl rand -hex 32)
DATABASE_URL=sqlite:////var/lib/pqcs/pqcs.db
DASHBOARD_HOST=0.0.0.0
DASHBOARD_PORT=8080
EOF

# Initialize the database
sudo -u pqcs /opt/pqcs/venv/bin/python -c "
import sys
sys.path.insert(0, '/opt/pqcs')
from pqcs.db import init_db
from pqcs.config import AppConfig
config = AppConfig()
init_db(config.database.url)
print('Database initialized successfully')
"

# Set proper permissions
chmod 600 /opt/pqcs/.env
chmod 750 /var/lib/pqcs
chmod 644 /var/lib/pqcs/pqcs.db 2>/dev/null || true
Create systemd service file:
sudo tee /etc/systemd/system/pqcs.service << 'EOF'
[Unit]
Description=CERIA Dashboard
After=network.target

[Service]
Type=simple
User=pqcs
Group=pqcs
WorkingDirectory=/opt/pqcs
Environment="PATH=/opt/pqcs/venv/bin"
EnvironmentFile=-/opt/pqcs/.env
ExecStart=/opt/pqcs/venv/bin/uvicorn pqcs.web.app:create_app --host 0.0.0.0 --port 8080
Restart=always
RestartSec=10
StandardOutput=append:/var/log/pqcs/app.log
StandardError=append:/var/log/pqcs/error.log

[Install]
WantedBy=multi-user.target
EOF
Enable and start the service:
# Reload systemd to recognize new service
sudo systemctl daemon-reload

# Enable service to start on boot
sudo systemctl enable pqcs

# Start the service
sudo systemctl start pqcs

# Check status
sudo systemctl status pqcs
You should see output like:
● pqcs.service - CERIA Dashboard
     Loaded: loaded (/etc/systemd/system/pqcs.service; enabled)
     Active: active (running) since Fri 2026-07-10 10:00:00 UTC
     Main PID: 12345 (uvicorn)
Systemd Service
Create /etc/systemd/system/pqcs.service:
[Unit]
Description=CERIA Dashboard
After=network.target

[Service]
Type=simple
User=pqcs
Group=pqcs
WorkingDirectory=/opt/pqcs
Environment="PATH=/opt/pqcs/venv/bin"
EnvironmentFile=/opt/pqcs/.env
ExecStart=/opt/pqcs/venv/bin/uvicorn pqcs.web.app:create_app --host 0.0.0.0 --port 8080
Restart=always
RestartSec=10

[Install]
WantedBy=multi-user.target
Start service:
sudo systemctl daemon-reload
sudo systemctl enable pqcs
sudo systemctl start pqcs
Nginx Reverse Proxy
server {
    listen 80;
    server_name pqcs.example.com;
    return 301 https://$server_name$request_uri;
}

server {
    listen 443 ssl http2;
    server_name pqcs.example.com;

    ssl_certificate /etc/letsencrypt/live/pqcs.example.com/fullchain.pem;
    ssl_certificate_key /etc/letsencrypt/live/pqcs.example.com/privkey.pem;

    location / {
        proxy_pass http://127.0.0.1:8080;
        proxy_http_version 1.1;
        proxy_set_header Host $host;
        proxy_set_header X-Real-IP $remote_addr;
        proxy_set_header X-Forwarded-For $proxy_add_x_forwarded_for;
        proxy_set_header X-Forwarded-Proto $scheme;
    }

    location /static {
        alias /opt/pqcs/pqcs/web/static;
    }
}
Enable:
sudo ln -s /etc/nginx/sites-available/pqcs /etc/nginx/sites-enabled/
sudo nginx -t
sudo systemctl reload nginx
SSL/TLS Setup
Let's Encrypt (certbot)
# Install certbot
sudo apt-get install certbot python3-certbot-nginx

# Obtain certificate
sudo certbot --nginx -d pqcs.example.com

# Auto-renewal test
sudo certbot renew --dry-run
Security Hardening
File Permissions
# Database
chmod 600 /var/lib/pqcs/pqcs.db
chown pqcs:pqcs /var/lib/pqcs/pqcs.db

# Application
chmod 755 /opt/pqcs
chmod 644 /opt/pqcs/.env
chown -R pqcs:pqcs /opt/pqcs
Firewall Rules
# Allow only HTTPS
sudo ufw default deny incoming
sudo ufw allow ssh
sudo ufw allow 443/tcp
sudo ufw enable
Current Deployment
Current Deployment Reference
The official CERIA instance is deployed at:
Live URL: https://pqcs.dysfunktion.techDeployment Specifications
| Component | Configuration |
| Platform | cPanel Shared Hosting |
| Python Version | 3.11 |
| Database | SQLite at /home2/yusricom/db/pqcs.db |
| WSGI Handler | Custom FastAPI-to-WSGI wrapper |
| Web Server | Apache with Passenger |
| SSL | Let's Encrypt (AutoSSL) |
| Status | ✅ Production Ready |
Live Application Screenshots
Login Screen
Production login page at pqcs.dysfunktion.tech
Main Dashboard
Dashboard showing device summary, risk distribution, and priority devices
Scan Configuration
Scan configuration page for setting target ranges and collectors
Device Inventory
Device inventory with filtering and risk score display
System Settings
Settings page for SSH credentials, ports, and scanning parameters
Risk Analysis
Harvest Now Decrypt Later (HNDL) risk calculator
Reports
Reports and visualization page with risk heatmaps
Deployment Validation Checklist
Use this checklist to verify your deployment is working correctly:
| Feature | Expected Result | Screenshot |
| Login page loads | No errors, form visible | |
| Authentication works | Redirects to dashboard | |
| Dashboard displays | Stats visible, no errors | |
| Settings accessible | Form loads, values save | |
| Inventory shows devices | Device list loads | |
If all checks pass, your deployment matches the production instance! 🎉
Related Documentation
- Admin Guide - Post-deployment administration
- Troubleshooting - Common issues
- User Manual - Using the application
Last Updated: 2026-07-10
Cryptographic Collectors
1. TLS/SSL Collector
Scans for:- TLS versions (1.0, 1.1, 1.2, 1.3)
- Cipher suites (quantum-vulnerable vs PQC-ready)
- Certificate chains
- Weak signatures (MD5, SHA-1)
- Hybrid certificates
TLS collector finds certificates and cipher suites on HTTPS services
Tools: sslyze, nmap scripts
Confidence: 0.95
Default Ports: 443, 8443, 9443
Example findings in device detail:
Detail view of TLS assets including certificates and cipher suites
2. SSH Collector
Scans for:- Key algorithms (RSA, ECDSA, Ed25519)
- KEX algorithms
- MAC algorithms
- Weak curves (secp192, secp224)
3. VPN Collector
Scans for:- IKE version (v1, v2)
- Transform proposals
- DH groups
4. Database Collector
Scans for:- Transparent Data Encryption (TDE)
- Connection encryption
- SSL/TLS configuration
5. OS Crypto Collector
Scans for:- System certificate stores
- Trusted root CAs
- Installed certificates
6. App Config Collector
Scans for:- OpenSSL configs
- Java keystores
- Algorithm configurations
7. Certificate Store Collector
Scans for:- Certificate files (.pem, .crt, .p12)
- Trust stores
- Private key files
Default Ports
SSH
- 22, 2222
TLS/HTTPS
- 443, 8443, 4443, 993, 995, 990, 636, 3269, 8080, 9090
VPN
- 500, 4500, 1194, 1723
Database
- 5432 (PostgreSQL)
- 1433 (MSSQL)
- 3306 (MySQL)
- 1521 (Oracle)
- 27017 (MongoDB)
- 6379 (Redis)
- 9042 (Cassandra)
- 143, 993 (IMAP)
- 110, 995 (POP3)
- 25, 465, 587 (SMTP)
LDAP/Kerberos
- 389, 636, 88, 3268, 3269
RDP/VNC
- 3389, 5900, 5901
SMB
- 135, 139, 445
Custom Ports
Add custom ports in Settings:
Format: comma-separated or ranges
Example: 9000,9001,9002-9010,10000
Screenshots Gallery
Visual walkthrough of CERIA interface.
Login & Authentication
Login Page
Initial login screen - JWT authentication
Login Form
Login form with credentials entered
Main Interface
Dashboard
Main dashboard showing PQC readiness and risk distribution
Dashboard - Risk Priority View
Risk priority cards and device summary
Scan Control
Configure and start network scans
Risk & Compliance
HNDL Risk Analysis
Harvest Now Decrypt Later overview
HNDL on Device Detail
Mosca's Inequality calculation per device
Risk Scoring Weights
Adjust SCAD framework criterion weights
Scanning & Results
Device Inventory
All discovered devices with risk scores
Scan Results
Detailed scan results with device breakdown
Settings
Application configuration and credentials
Certificates & Assets
Certificate Store
All certificates with PQC status
Device Crypto Assets
Cryptographic assets per device
Reports & Visualization
Reports Page
Risk heatmap, certificate expiry timeline, PQC readiness charts
Report Visualizations
Detailed charts and analytics
CLI Interface
CLI Dashboard
Command-line interface dashboard
Screenshots from live deployment: https://pqcs.dysfunktion.tech
Troubleshooting
Common Issues
403 Forbidden (cPanel)
Symptom: Browser shows "403 Forbidden" error Visual indicator:
Expected: This login page should appear. If you see 403 instead, check permissions.
Solution:
# Fix file permissions via SSH
cd /home/username/public_html/pqcs.example.com
chmod 644 .htaccess passenger_wsgi.py
chmod 755 pqcs/
500 Internal Server Error
Symptom: "500 Internal Server Error" page Solution:- Check cPanel > Logs > Error Log
- Verify Python dependencies:
source /home/username/virtualenv/pqcs/3.11/bin/activate
pip install -r requirements.txt
- Check
passenger_wsgi.pysyntax:
python -m py_compile passenger_wsgi.py
Database Connection Issues
Symptom: "OperationalError: unable to open database file" Solution:# Create database directory outside web root
mkdir -p /home/username/db
chmod 755 /home/username/db
chmod 666 /home/username/db/pqcs.db # or 644 after creation
# Update DATABASE_URL environment variable:
# sqlite:////home/username/db/pqcs.db
Login Failures (422 Error)
Symptom: "Failed to load resource: the server responded with a status of 422"
If login fails after entering correct credentials:
Solution:
- Ensure
SECRET_KEYenvironment variable is set in cPanel - Check
bcryptandpyjwtare installed:
pip list | grep -E 'bcrypt|PyJWT'
- Reset password via CLI if needed:
python << 'EOF'
import bcrypt
from pqcs.db import init_db, User
from pqcs.config import AppConfig

config = AppConfig()
db = init_db(config.database.url)

user = db.query(User).filter_by(username="admin").first()
if user:
    new_pw = bcrypt.hashpw(b"admin", bcrypt.gensalt())
    user.password_hash = new_pw.decode()
    db.commit()
    print("Password reset to: admin")
EOF
SSH Connection Failures
- Verify SSH credentials in Settings page:
Configure SSH credentials in Settings page
- Check known_hosts file
- Verify firewall allows SSH (port 22)
Application Won't Start
cPanel specific:- Check app shows as "Running" in cPanel Python App
- Verify
passenger_wsgi.pyexists and exposesapplication - Restart the app:
cd /home/username/public_html/pqcs.example.com
mkdir -p tmp && touch tmp/restart.txt
Debug Mode
# Enable debug logging
ceria --verbose dashboard

# Or set environment variable
export LOG_LEVEL=DEBUG
ceria dashboard
Log Locations
| Platform | Location |
| Local | Console (--verbose) |
| cPanel | /home2/yusricom/logs/passenger.log |
| systemd | journalctl -u pqcs |
Getting Help
- Check this troubleshooting guide
- Review relevant section in User Manual
- Check application logs
- Open issue in repository